Land Cover Change in Jakarta
2021 | Tools: Google Earth Engine, ArcGIS
As part of a larger research project that investigates the political ecology of water insecurity in Jakarta as a sinking city, I explored the land and water dynamics measured through changes in land cover during major urbanization development phases in Jakarta.
Jakarta’s rapid urbanization have been characterized by the tension between providing space for people and making room for water to reduce the impact of urban stormwater runoff.

Land Cover Change in Jakarta 1989-2020
Using satellite imagery and remote sensing techniques, I classified land cover types into built-up area, non-built-up area, and waterbody. Employing spatial statistics, these land cover types were further quantified as baseline information for analysis of development in areas identified as flood-prone.
Enery Efficiency in New York City Buildings
2020 | with Geon Woo Lee | Tools: Python, InDesign
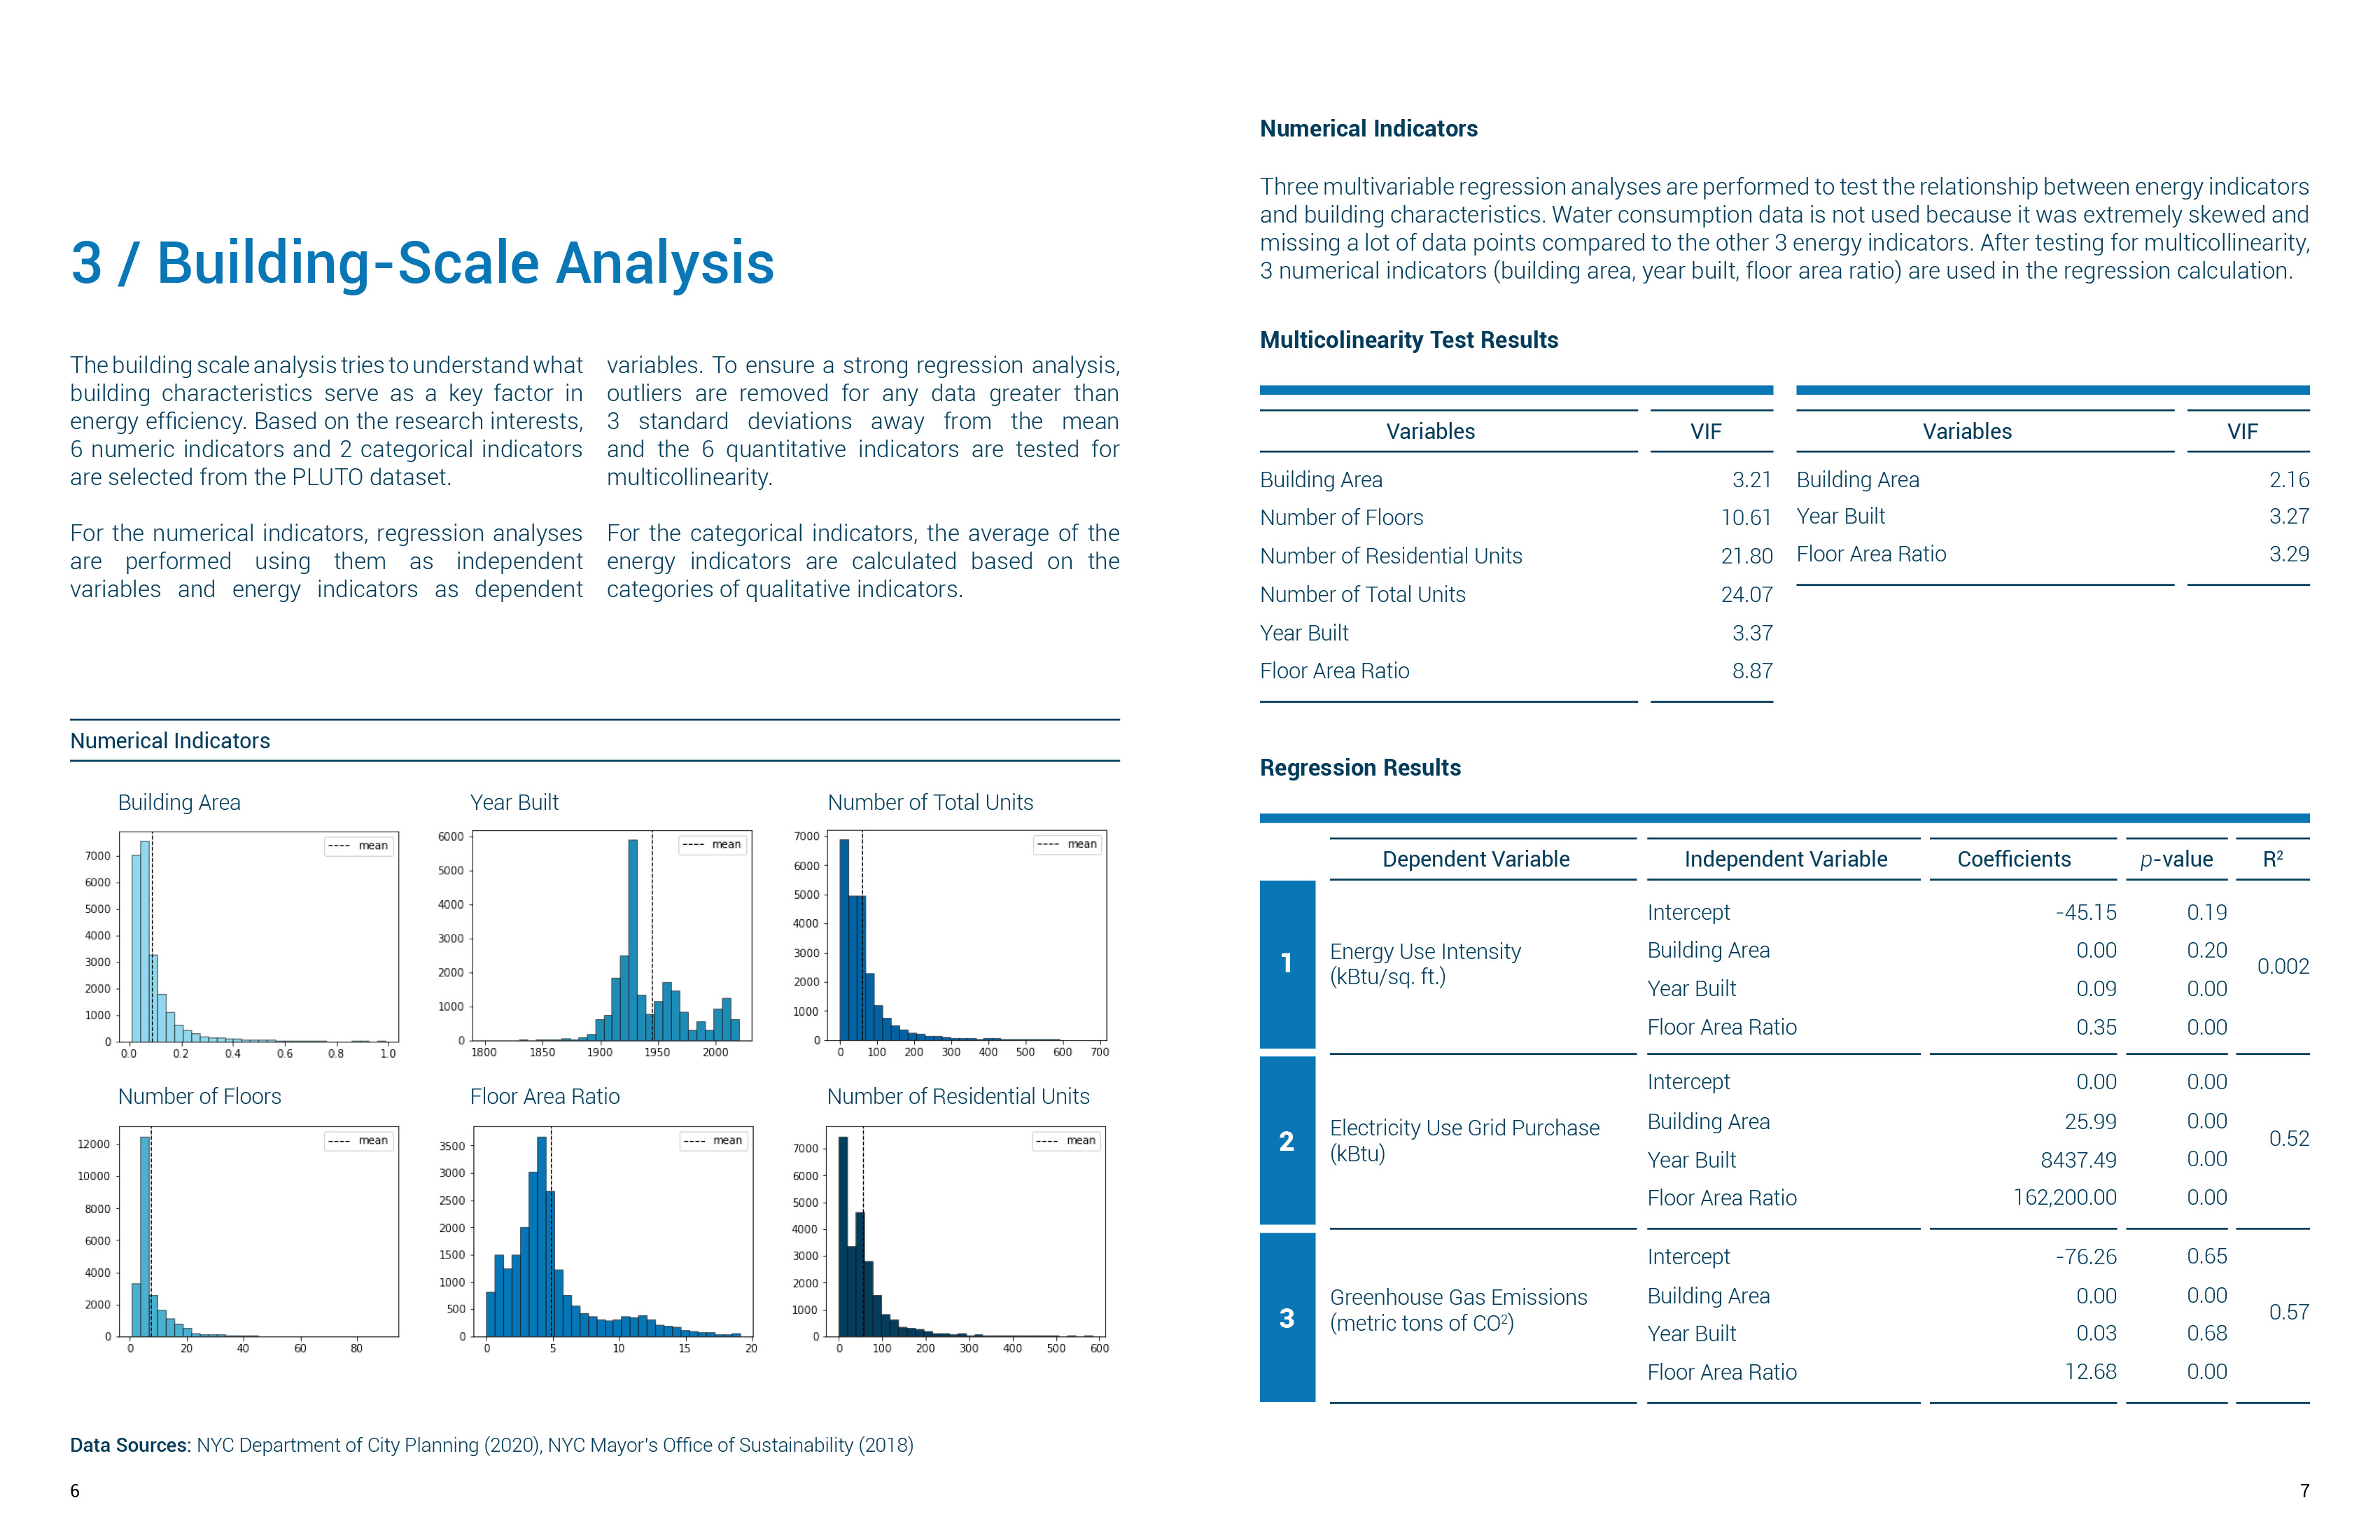
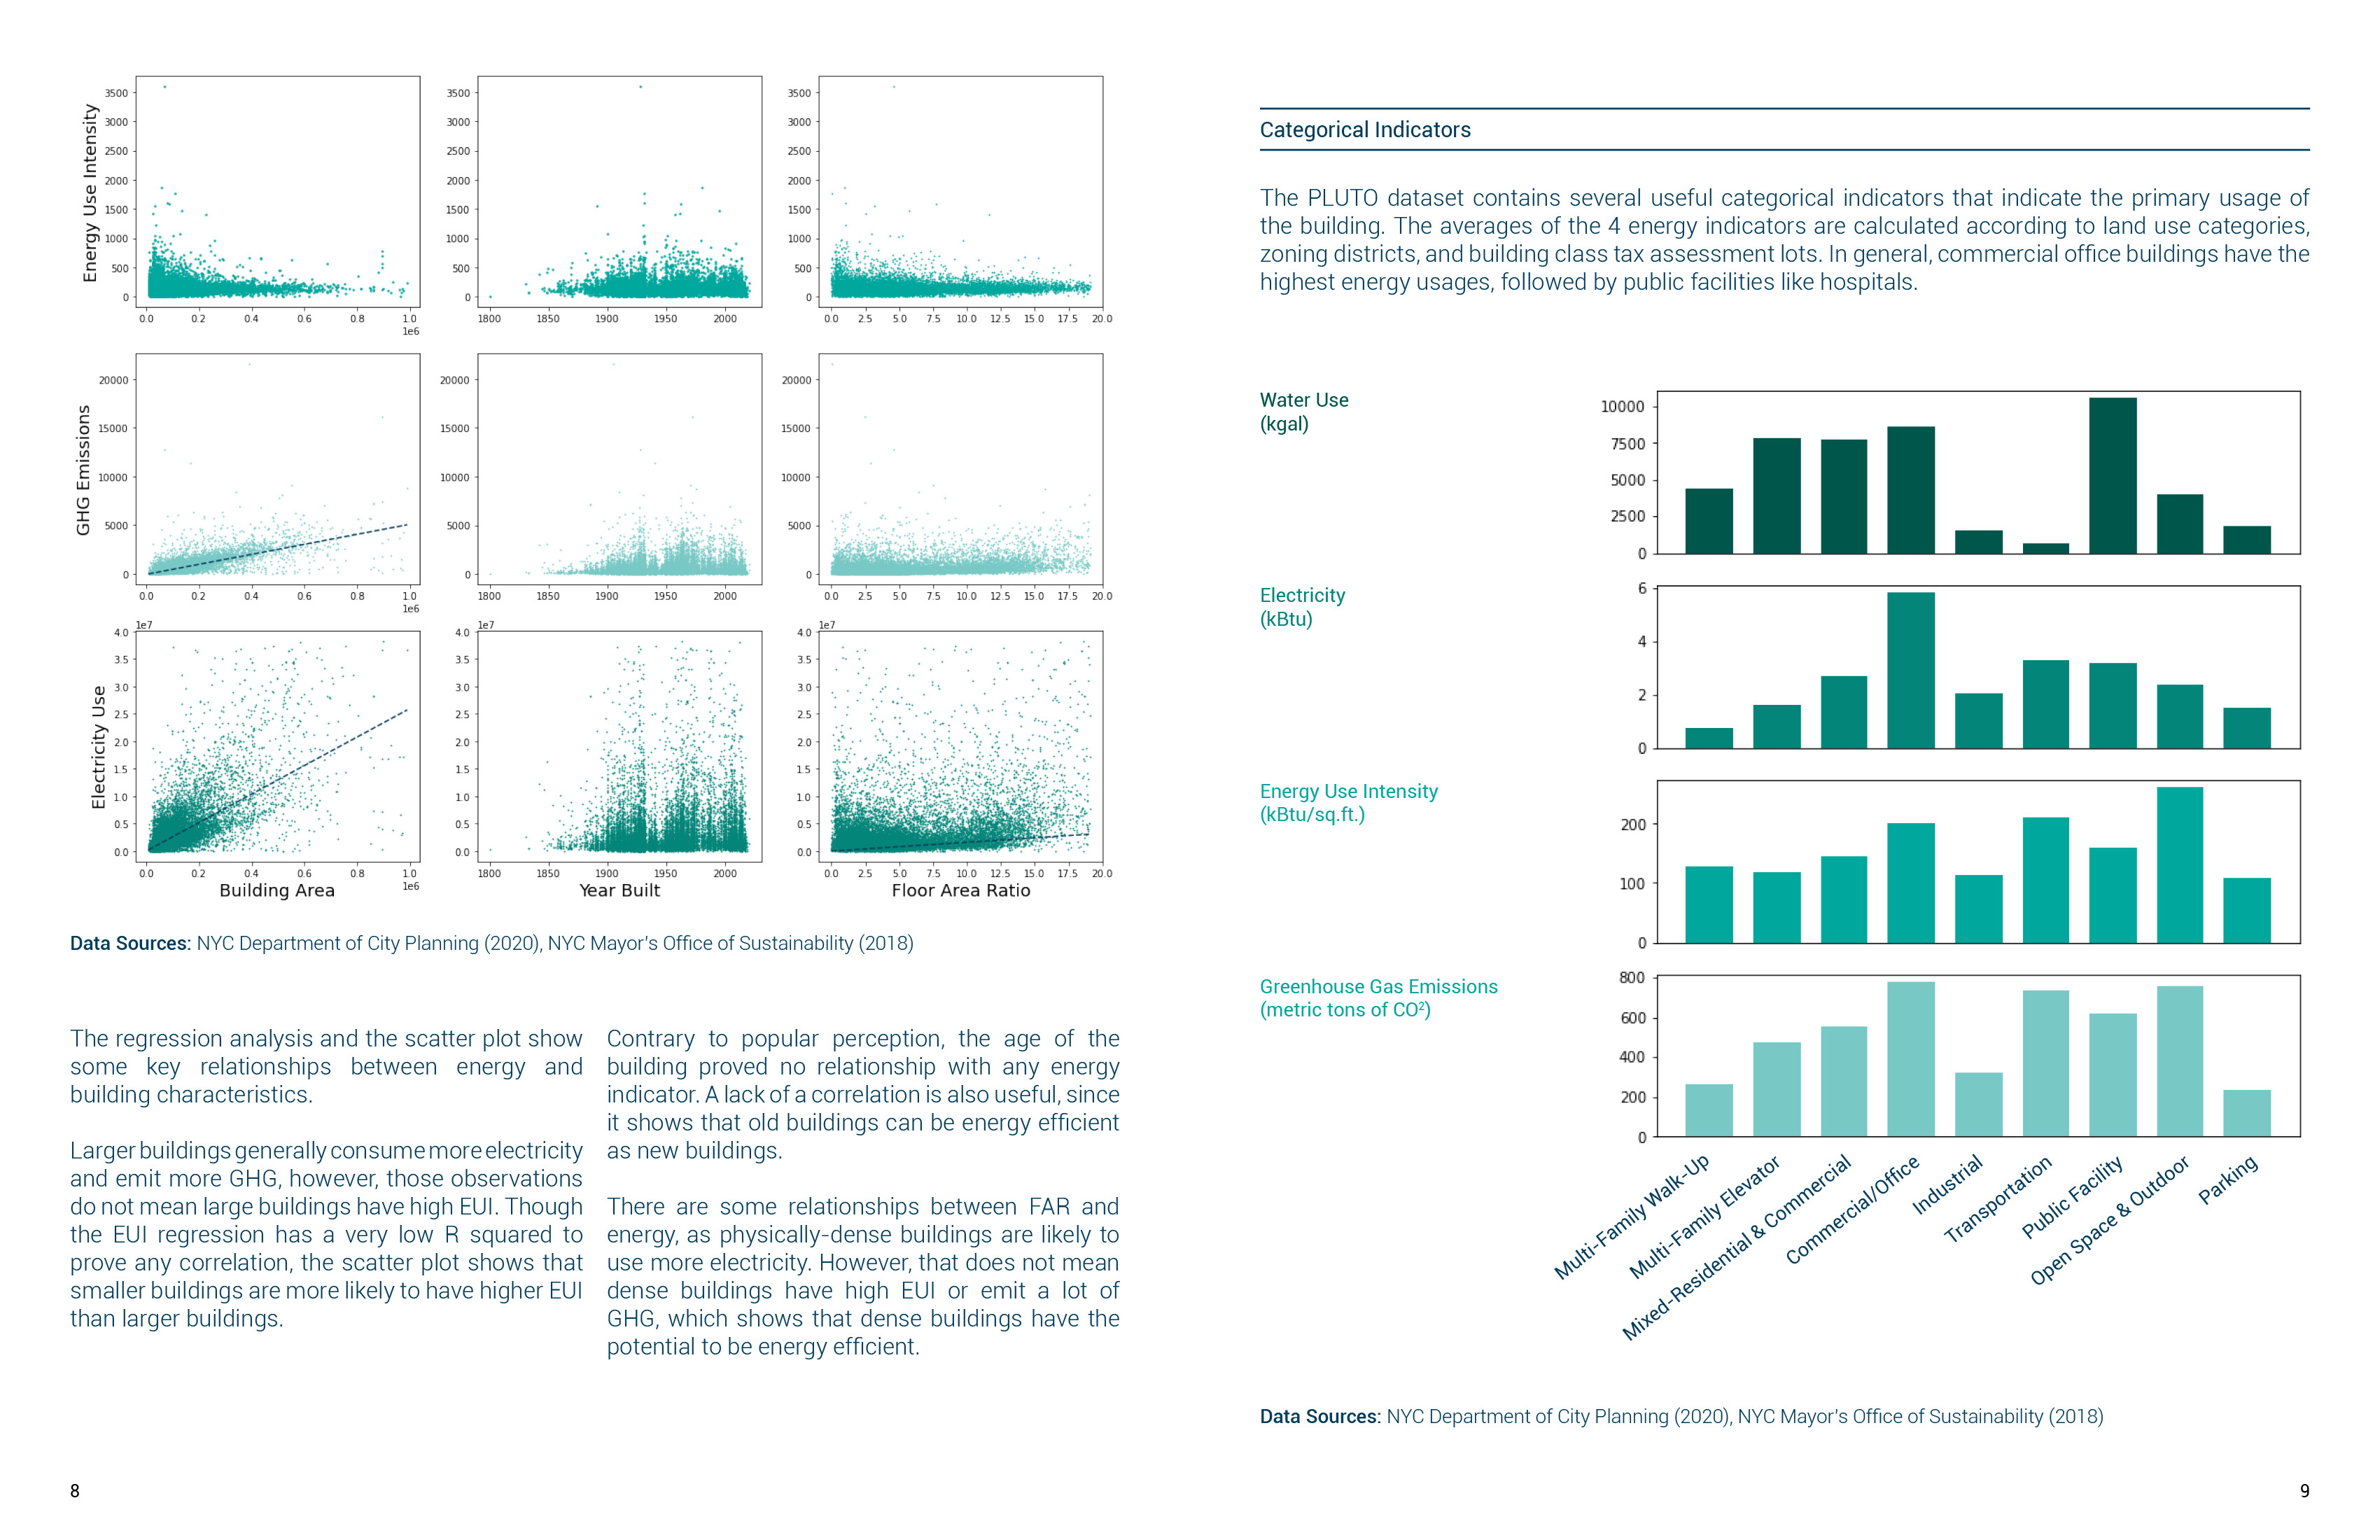
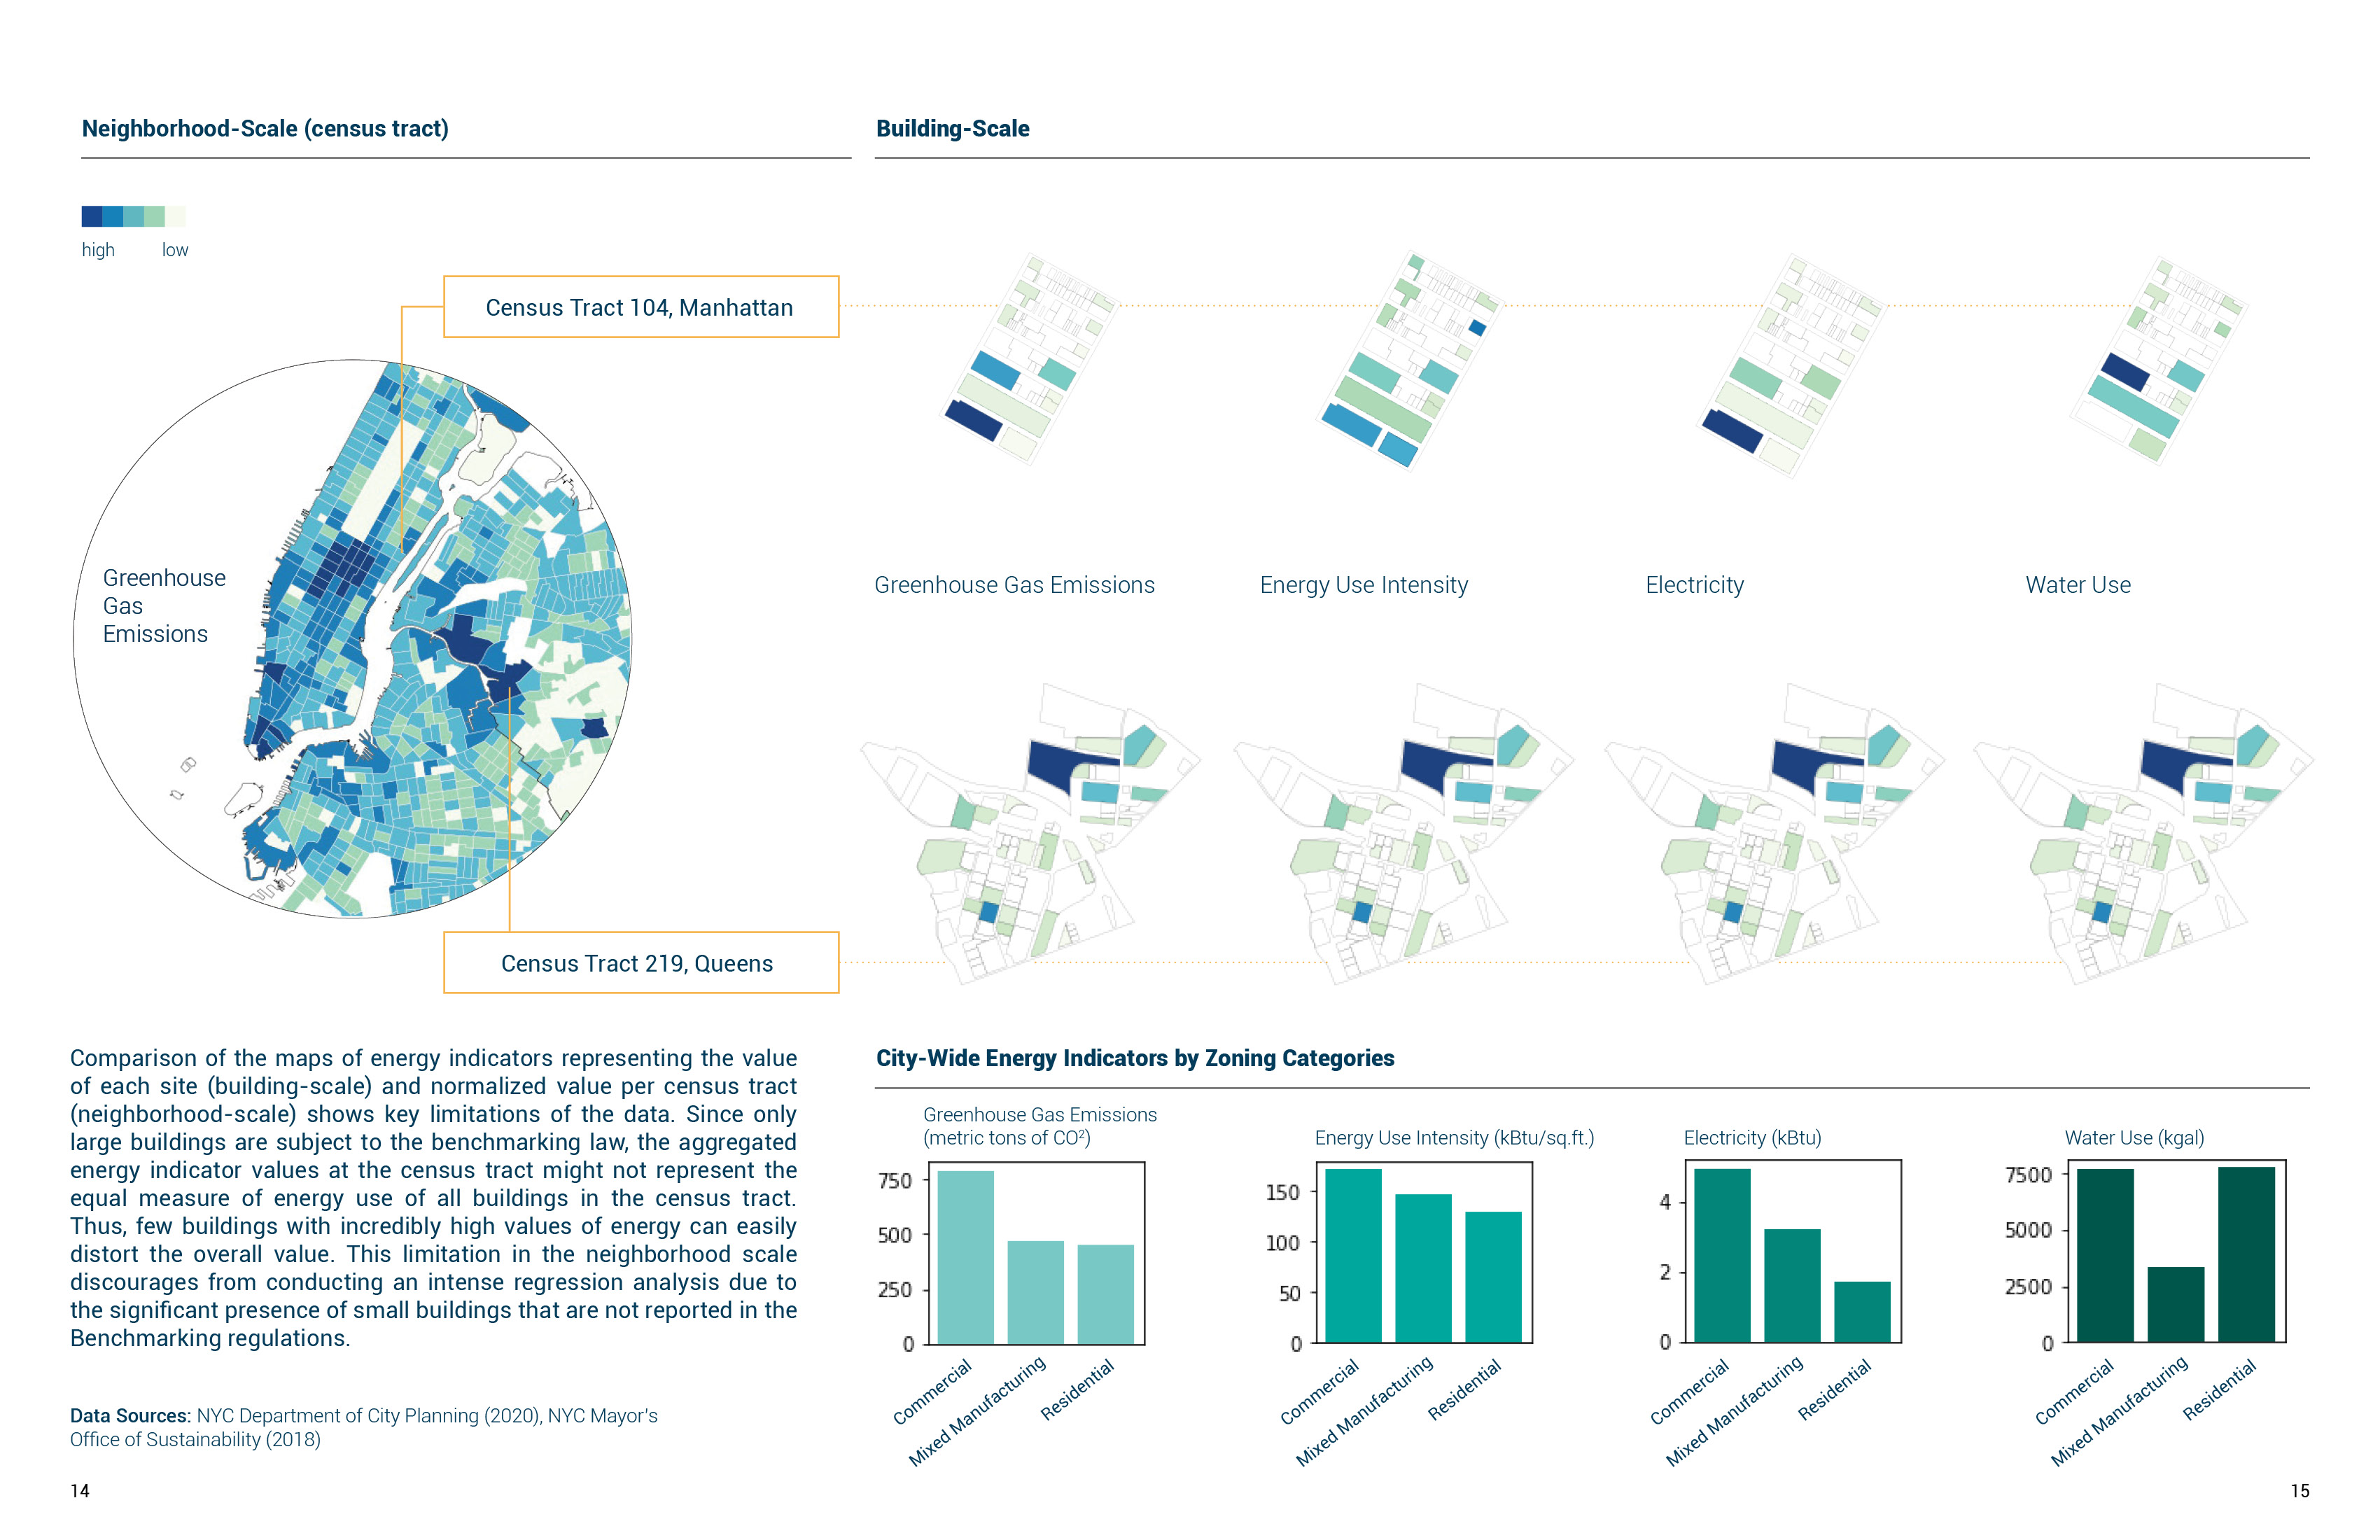
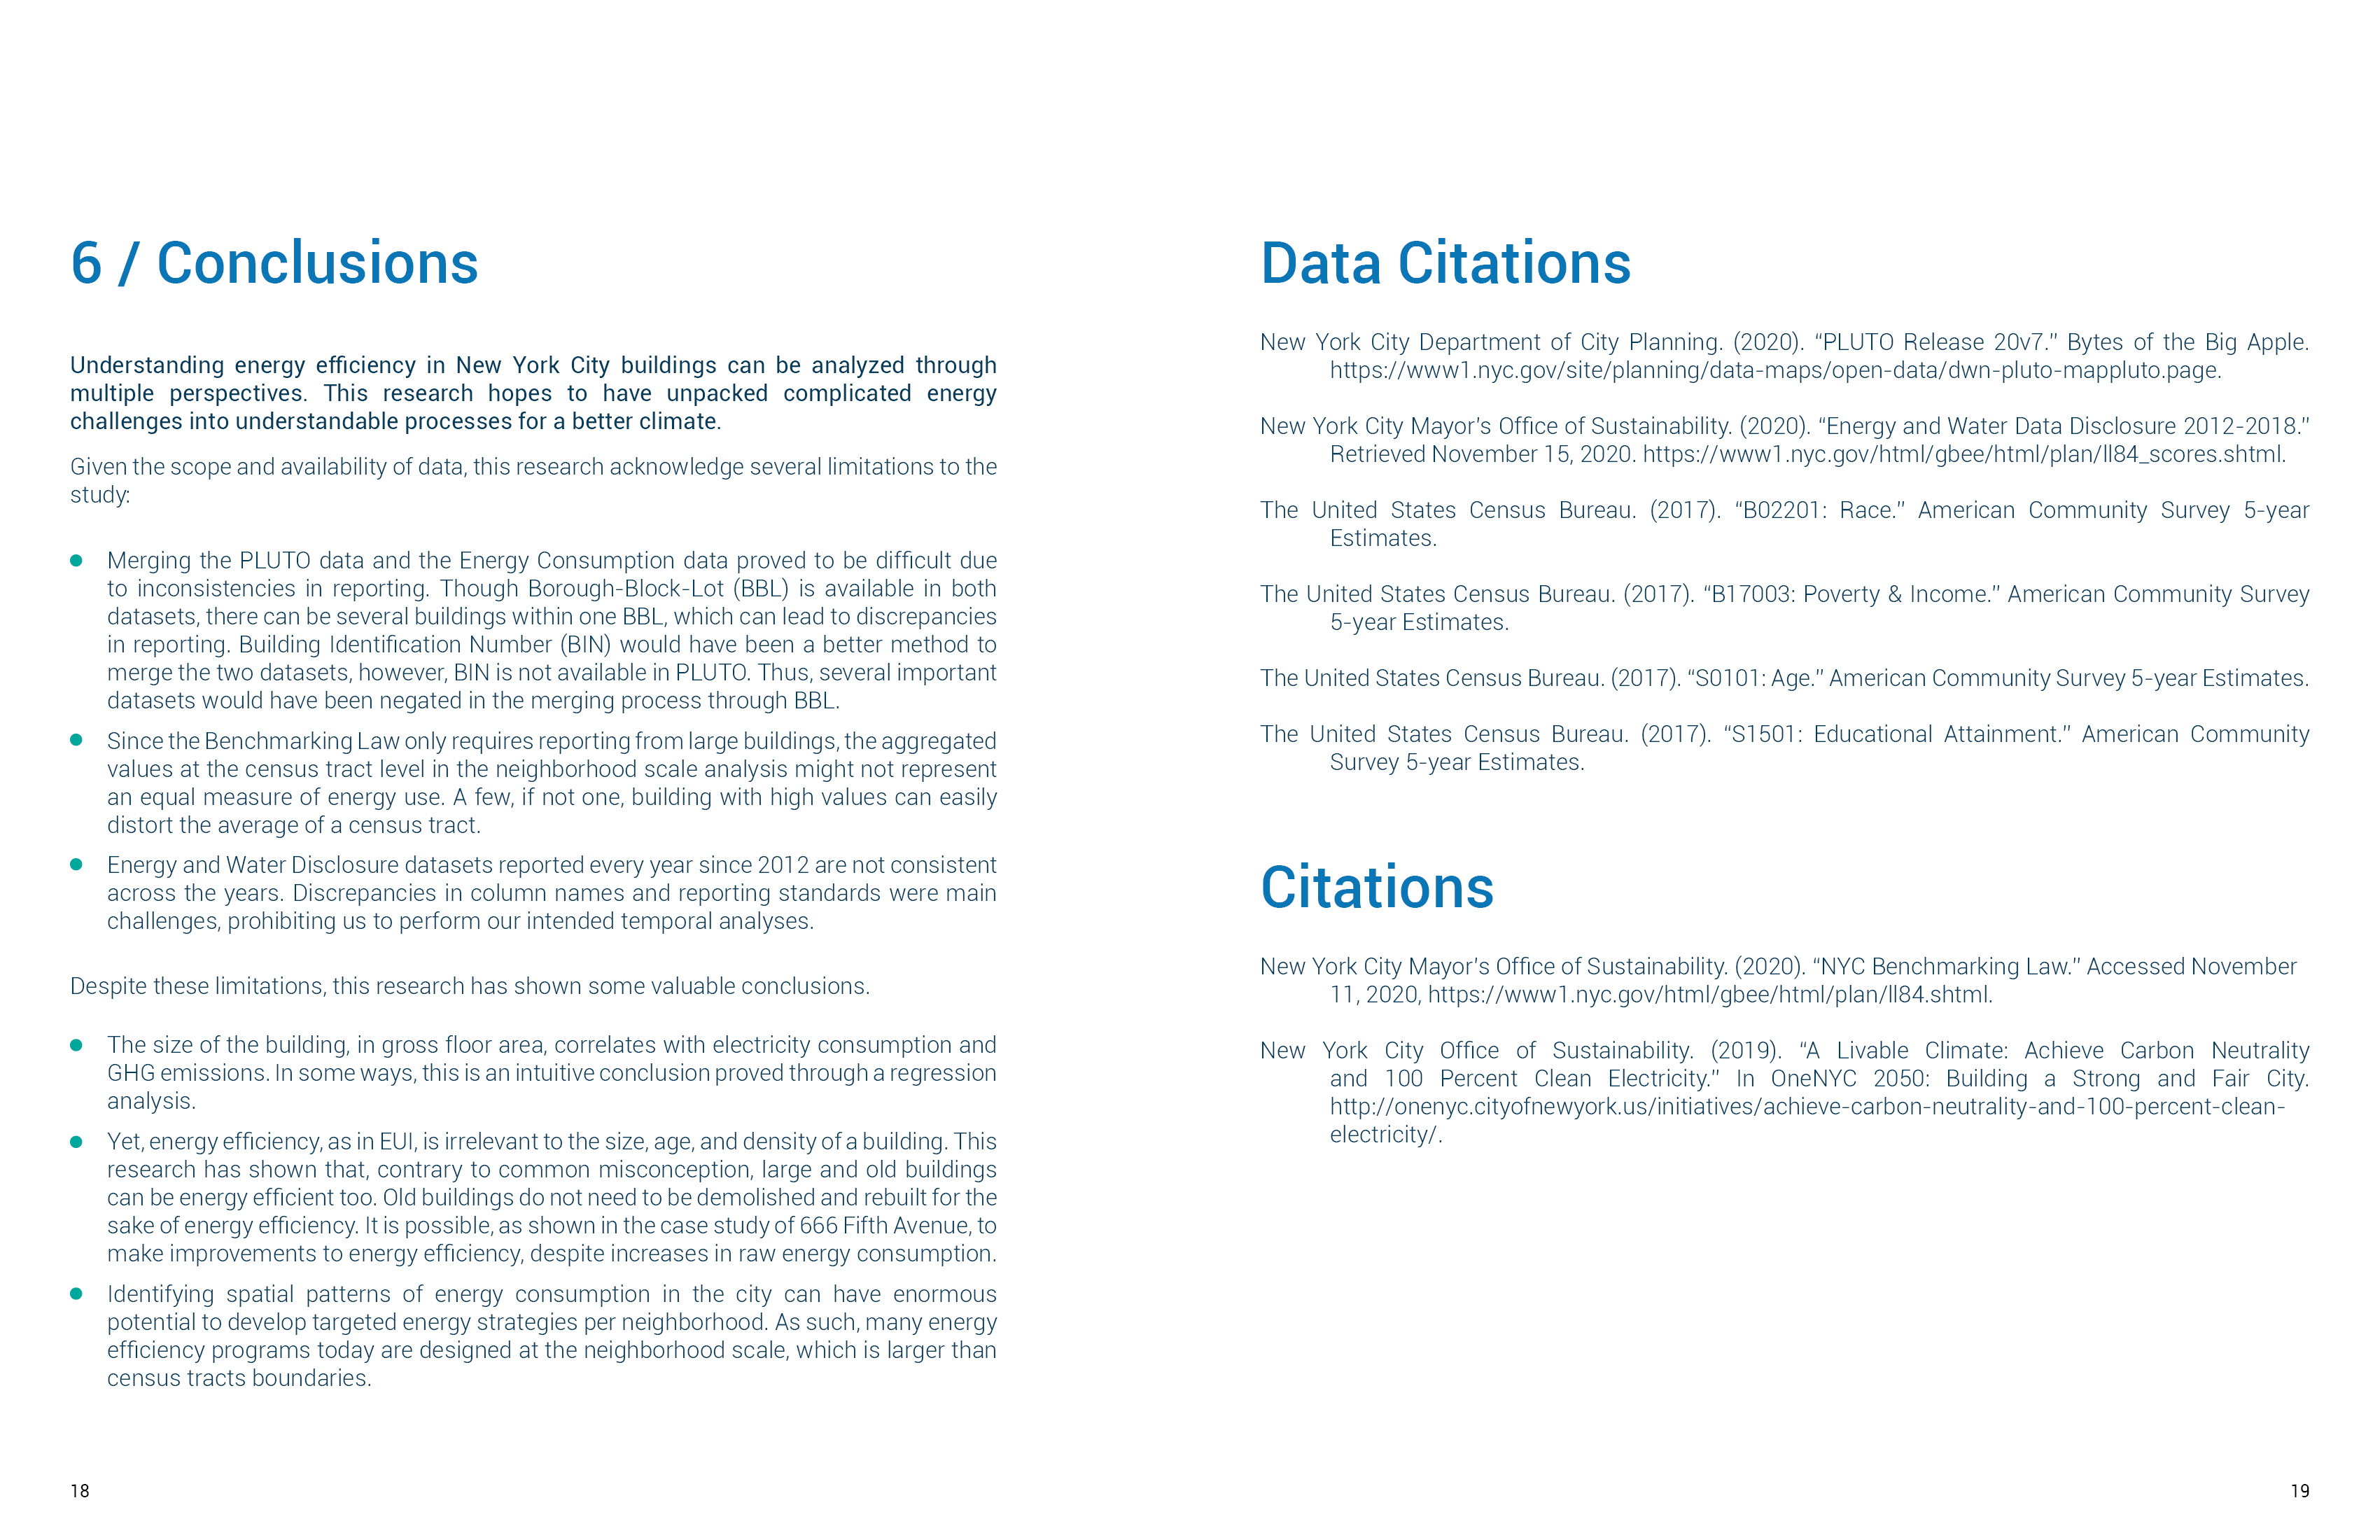
Improving energy efficiency in buildings plays a pivotal role in reducing carbon emissions in cities. In New York City, buildings account for 66% of the city’s greenhouse gas emissions, emitting at least 50 million metric tons of carbon dioxide to the air.
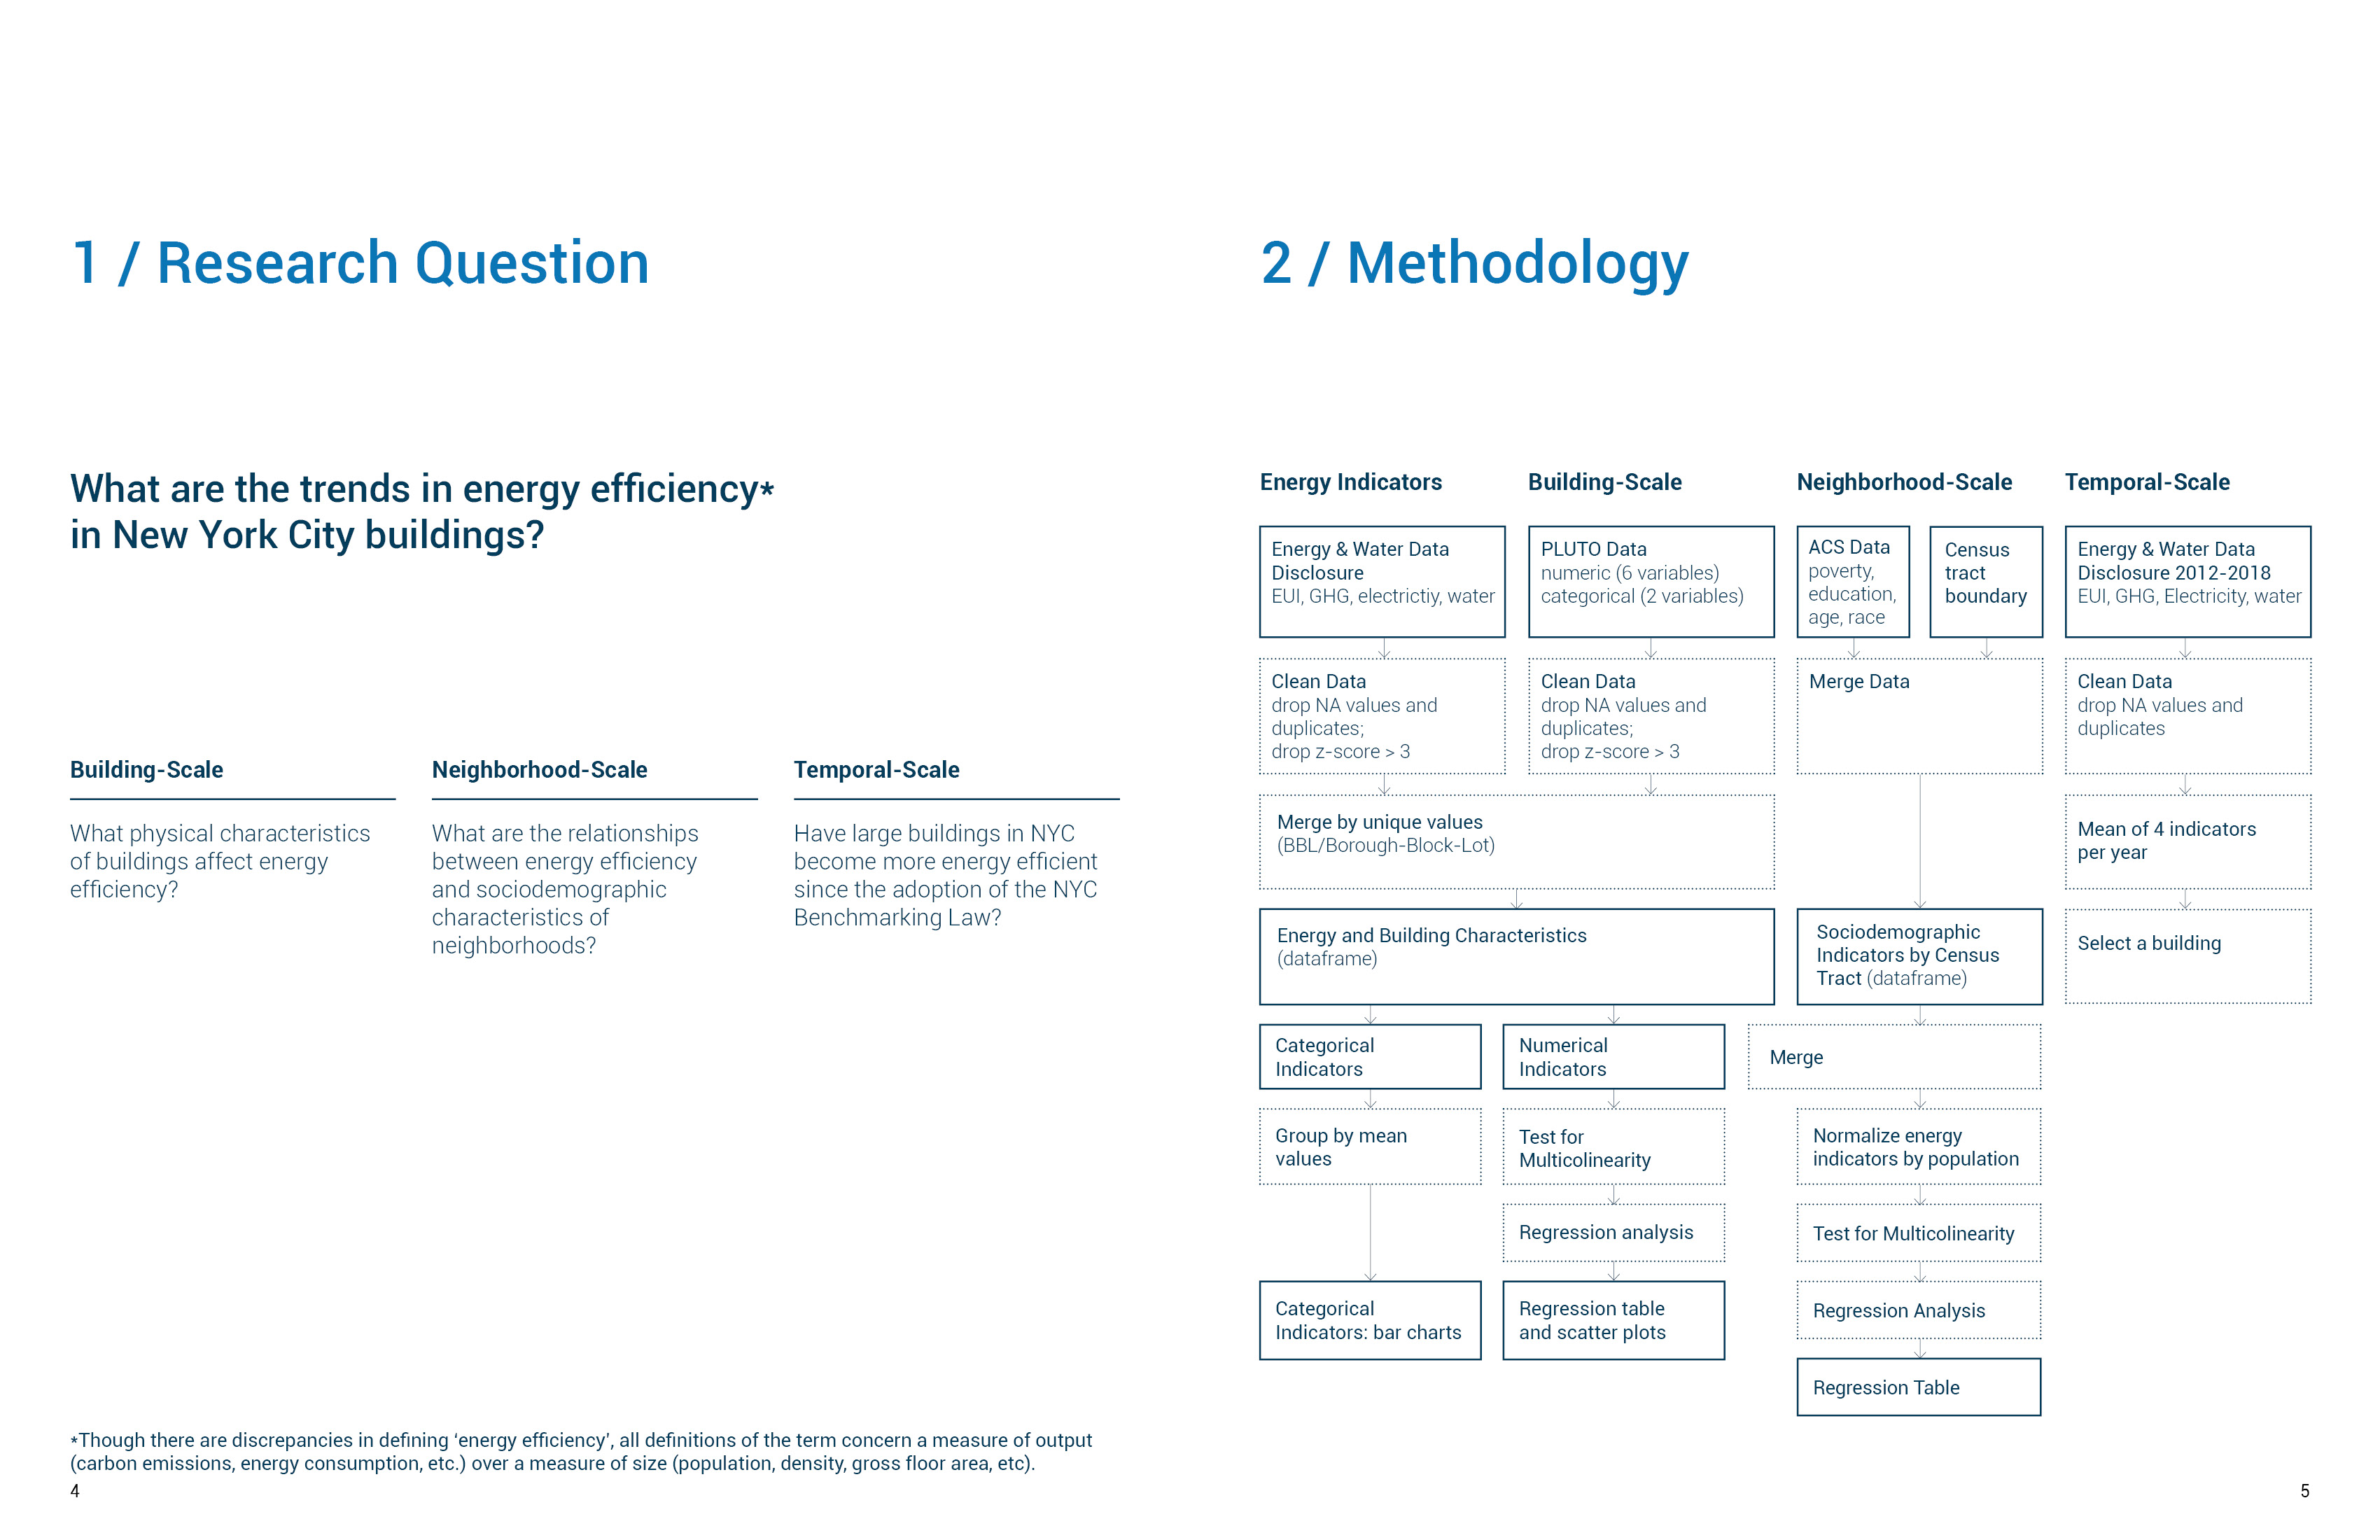
This project investigates the trends in energy efficiency in New York City buildings guided by the following research questions:
This project investigates the trends in energy efficiency in New York City buildings guided by the following research questions:
[Building Scale]
What physical characteristics of buildings affect energy efficiency?
[Neighborhood Scale]
What are the relationships between energy efficiency and sociodemographic characteristics of neighborhoods?
[Temporal Scale]
Have large buildings in NYC become more energy efficient since the adoption of the NYC Benchmarking Law?





Project Report
Identifying Disadvantaged Communities in New York City
2020 | with Angel Yin | Tools: QGIS, InDesign
In July 2019, New York State passed the Climate Leadership and Community Protection Act (CLCPA), a legally binding commitment to reduce greenhouse gas emissions and transition to renewable sources of electricity. In addition to these ambitious targets, the CLCPA highlights the protection of historically disadvantaged communities, defined as those that bear the burdens of environmental pollution and socioeconomic conditions or those that have experienced discrimination on the basis of race or ethnicity.
As part of the Grey-to-Green Energy Transition Spring 2020 Studio (full report), we developed a vulnerability index as a tool to identify disadvantaged communities in New York City. Building on literature reviews and case study analyses, we selected indicators based on (1) relevance to four components cited in the CLCPA policy document, (2) data representation, and (3) data source credibility and availability.

Case Study Analyses
Vulnerability Index Components and Subcomponents
The developed index comprises two main components: Population Characteristics and Pollution Burden.
The Population Characteristics component takes into account sensitive populations and socioeconomic factors while the Pollution Burden component considers indicators related to exposure to pollutants and adverse environmental conditions.
The range of values for each indicator were reclassified and scaled to score range of 1 to 10, representing the level of vulnerability at the census tract level. Lower scores mean lower vulnerability. The indicators were then used to create composite layers for each index subcomponent.
For the purpose of the project, we specifically examined Port Morris and Sunset Park neighborhoods as they are home to some of the peaker power plants in New York City that would need to be decommissioned.
Neighborhoods with high sensitive populations are those with high asthma rates, cardiovascular disease, proportions of elderly, minorities, and low birth weight. Meanwhile, the socioeconomic factors layer represents vulnerability based on indicators such as income, rent burden, unemployment, educational attainment, and home ownership. While there are variations of vulnerability based on Population Characteristics, we observed more vulnerability in Port Morris.
In terms of Pollution Burden, both neighborhoods have high risk of exposure to pollution, as a comulative result of variables such as proximity to toxic facilities, traffic congestions, and black carbon concentrations.


Vulnerability Index Subcomponent Layers
Vulnerability Index and Overall Analysis
The index equally weighted Population Characteristics component and Pollution Burden component considering the comparable importance of each component; each component was assigned a weight of one. The result yielded a score range of 50 to 185. The map below shows how Sunset Park and Port Morris neighborhoods score compared to neighborhoods with the lowest and highest scores, respectively.
The index equally weighted Population Characteristics component and Pollution Burden component considering the comparable importance of each component; each component was assigned a weight of one. The result yielded a score range of 50 to 185. The map below shows how Sunset Park and Port Morris neighborhoods score compared to neighborhoods with the lowest and highest scores, respectively.

Access to Healthy Food in New York City
2019 | with Yuning Feng and Elaine Hsieh | Tools: ArcGIS, Illustrator, InDesign
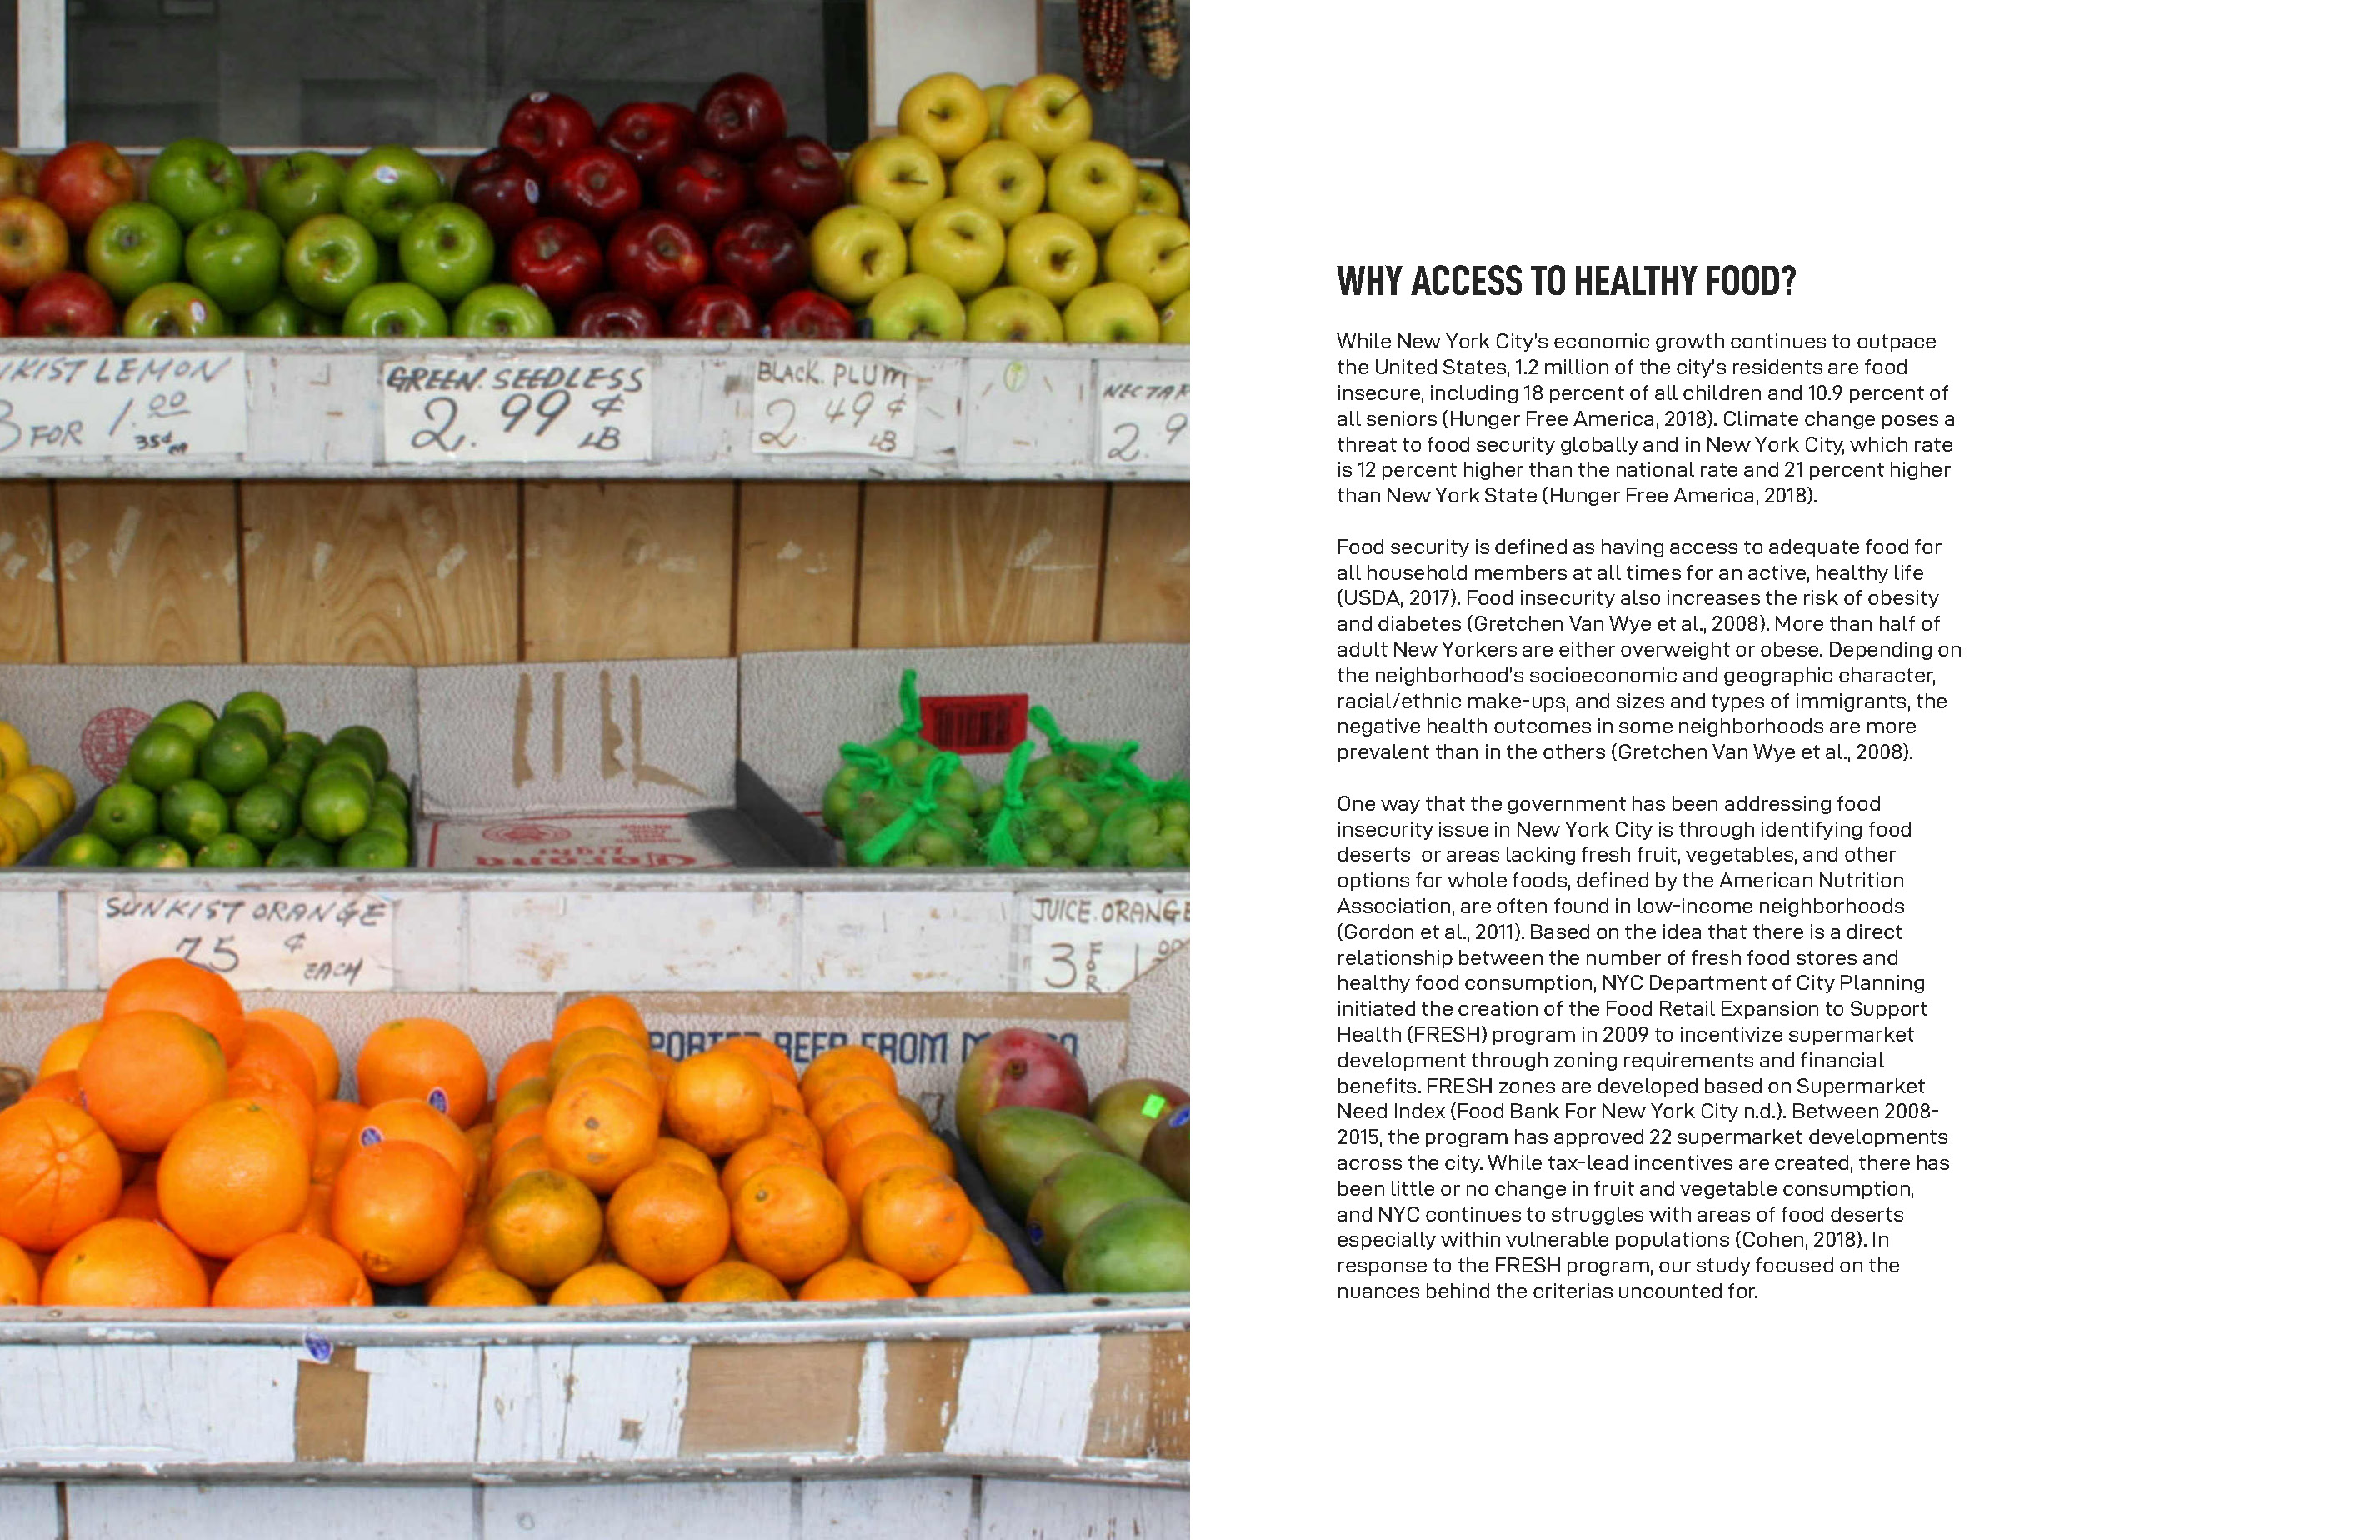
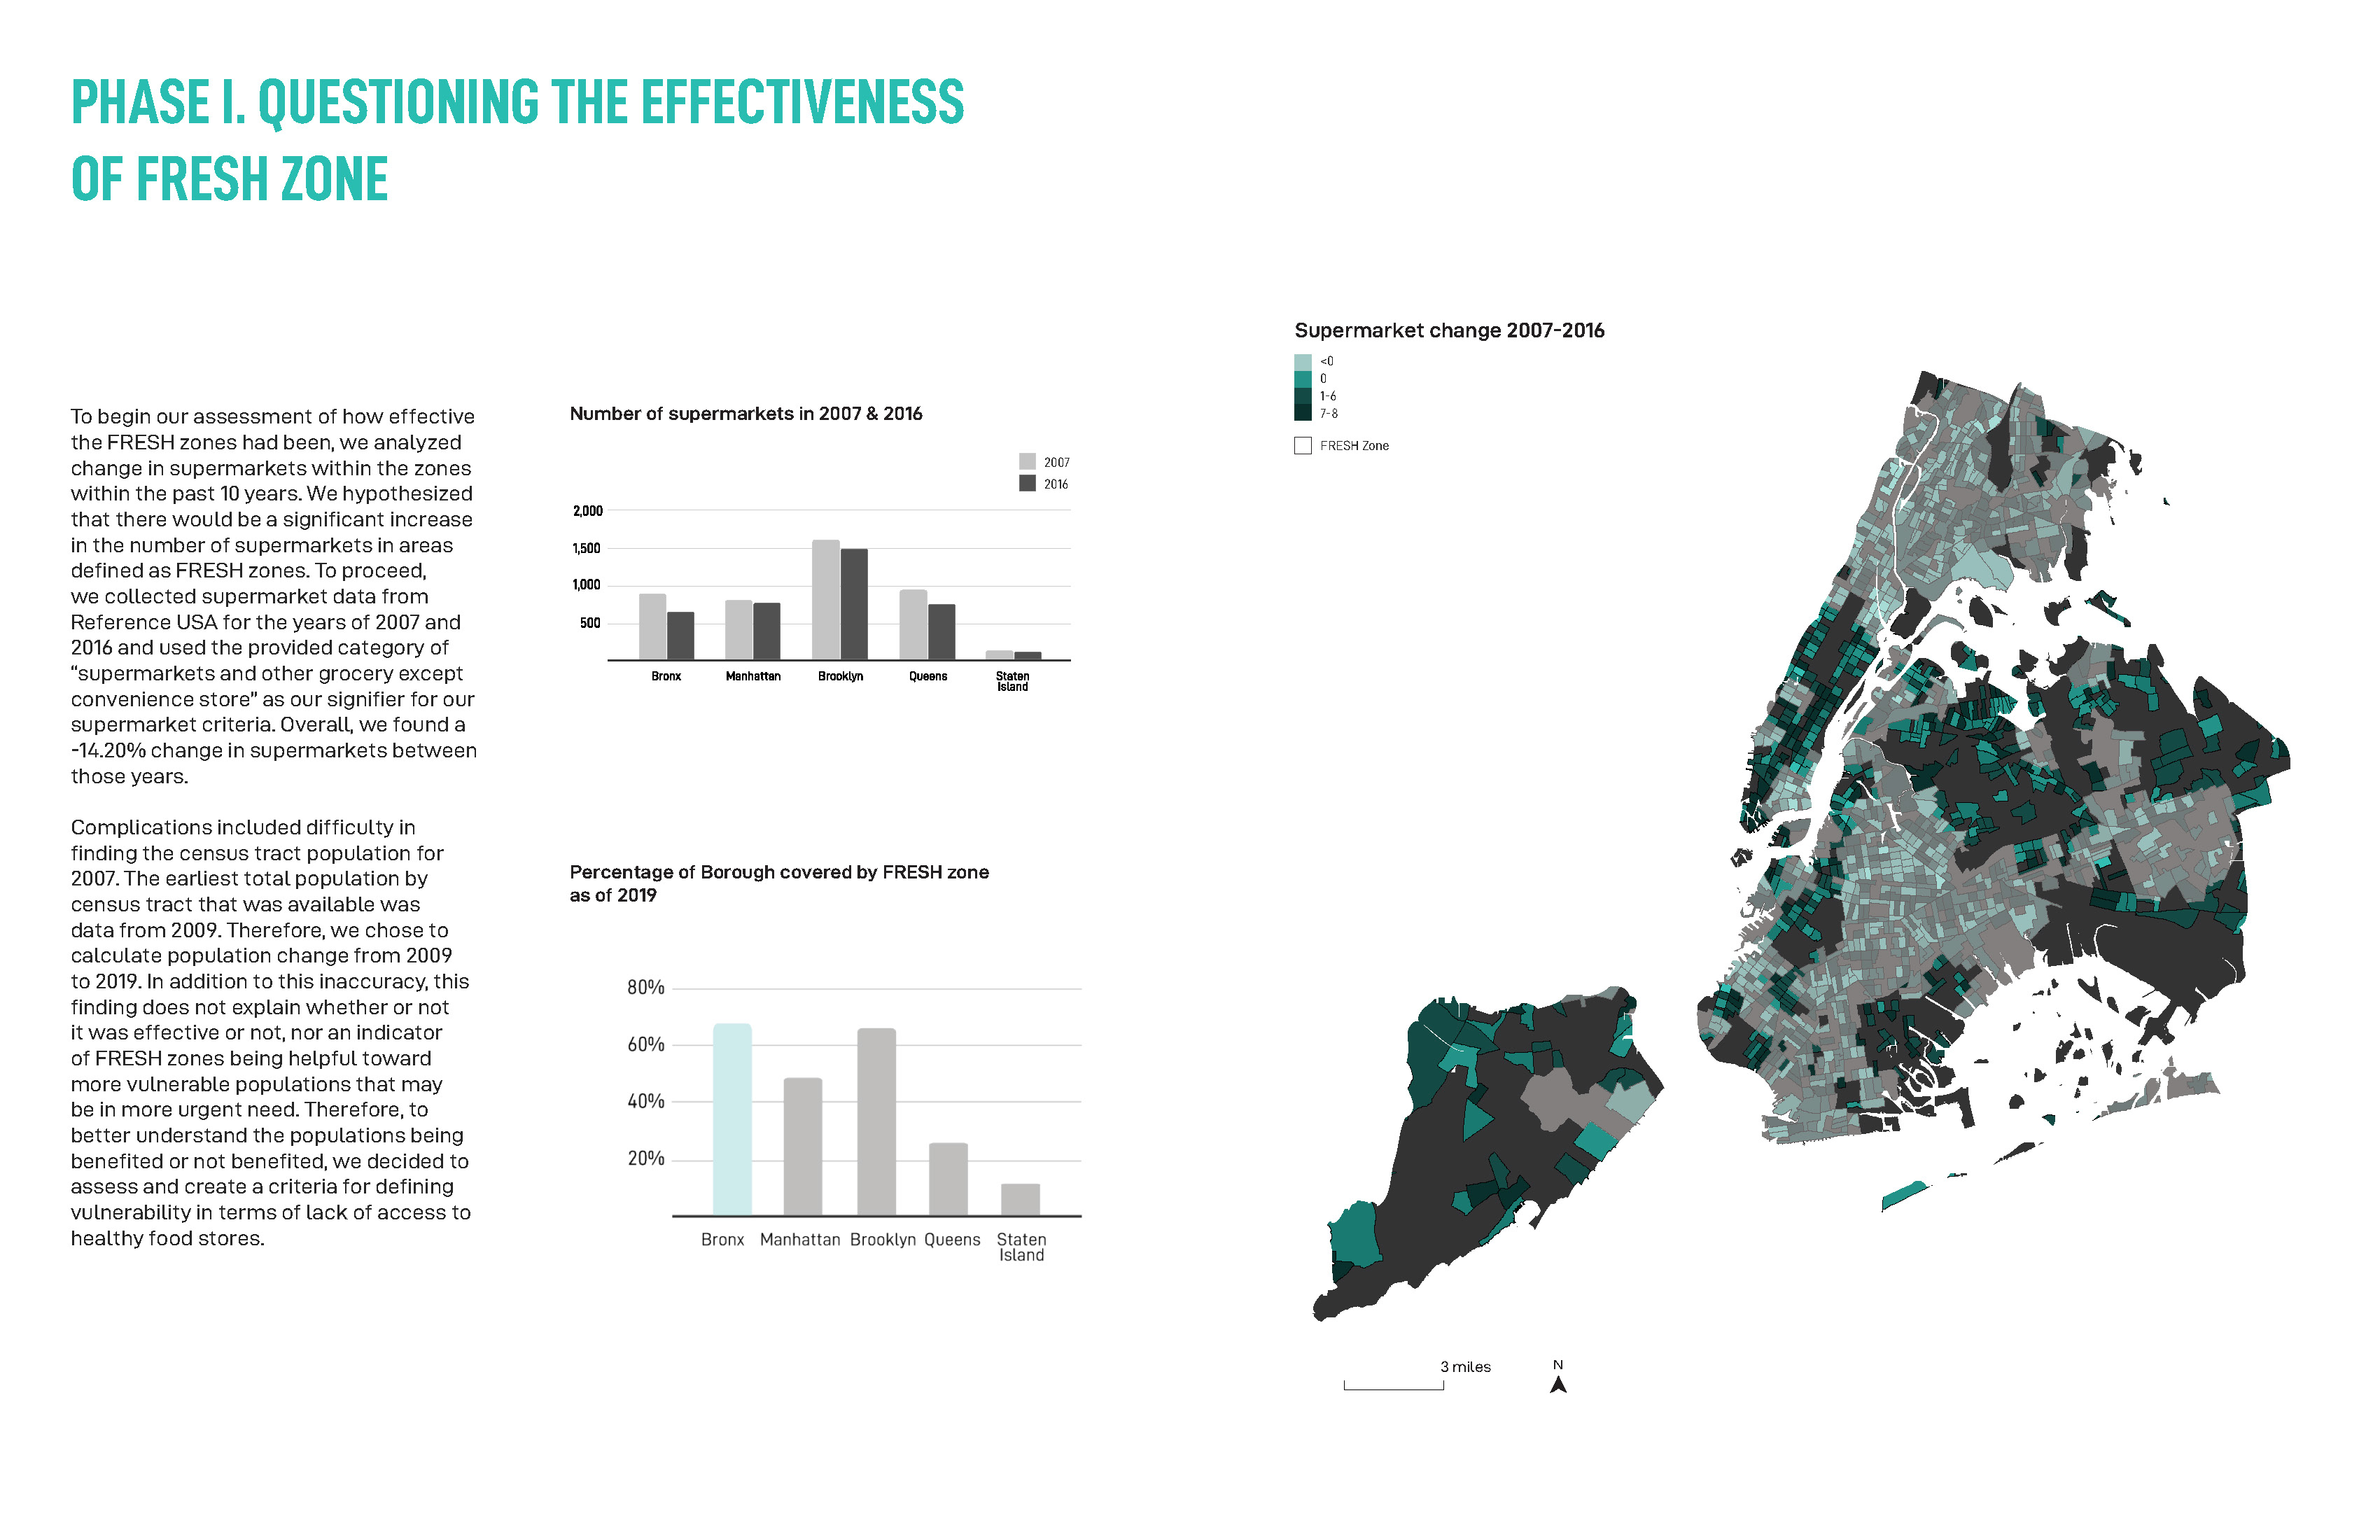
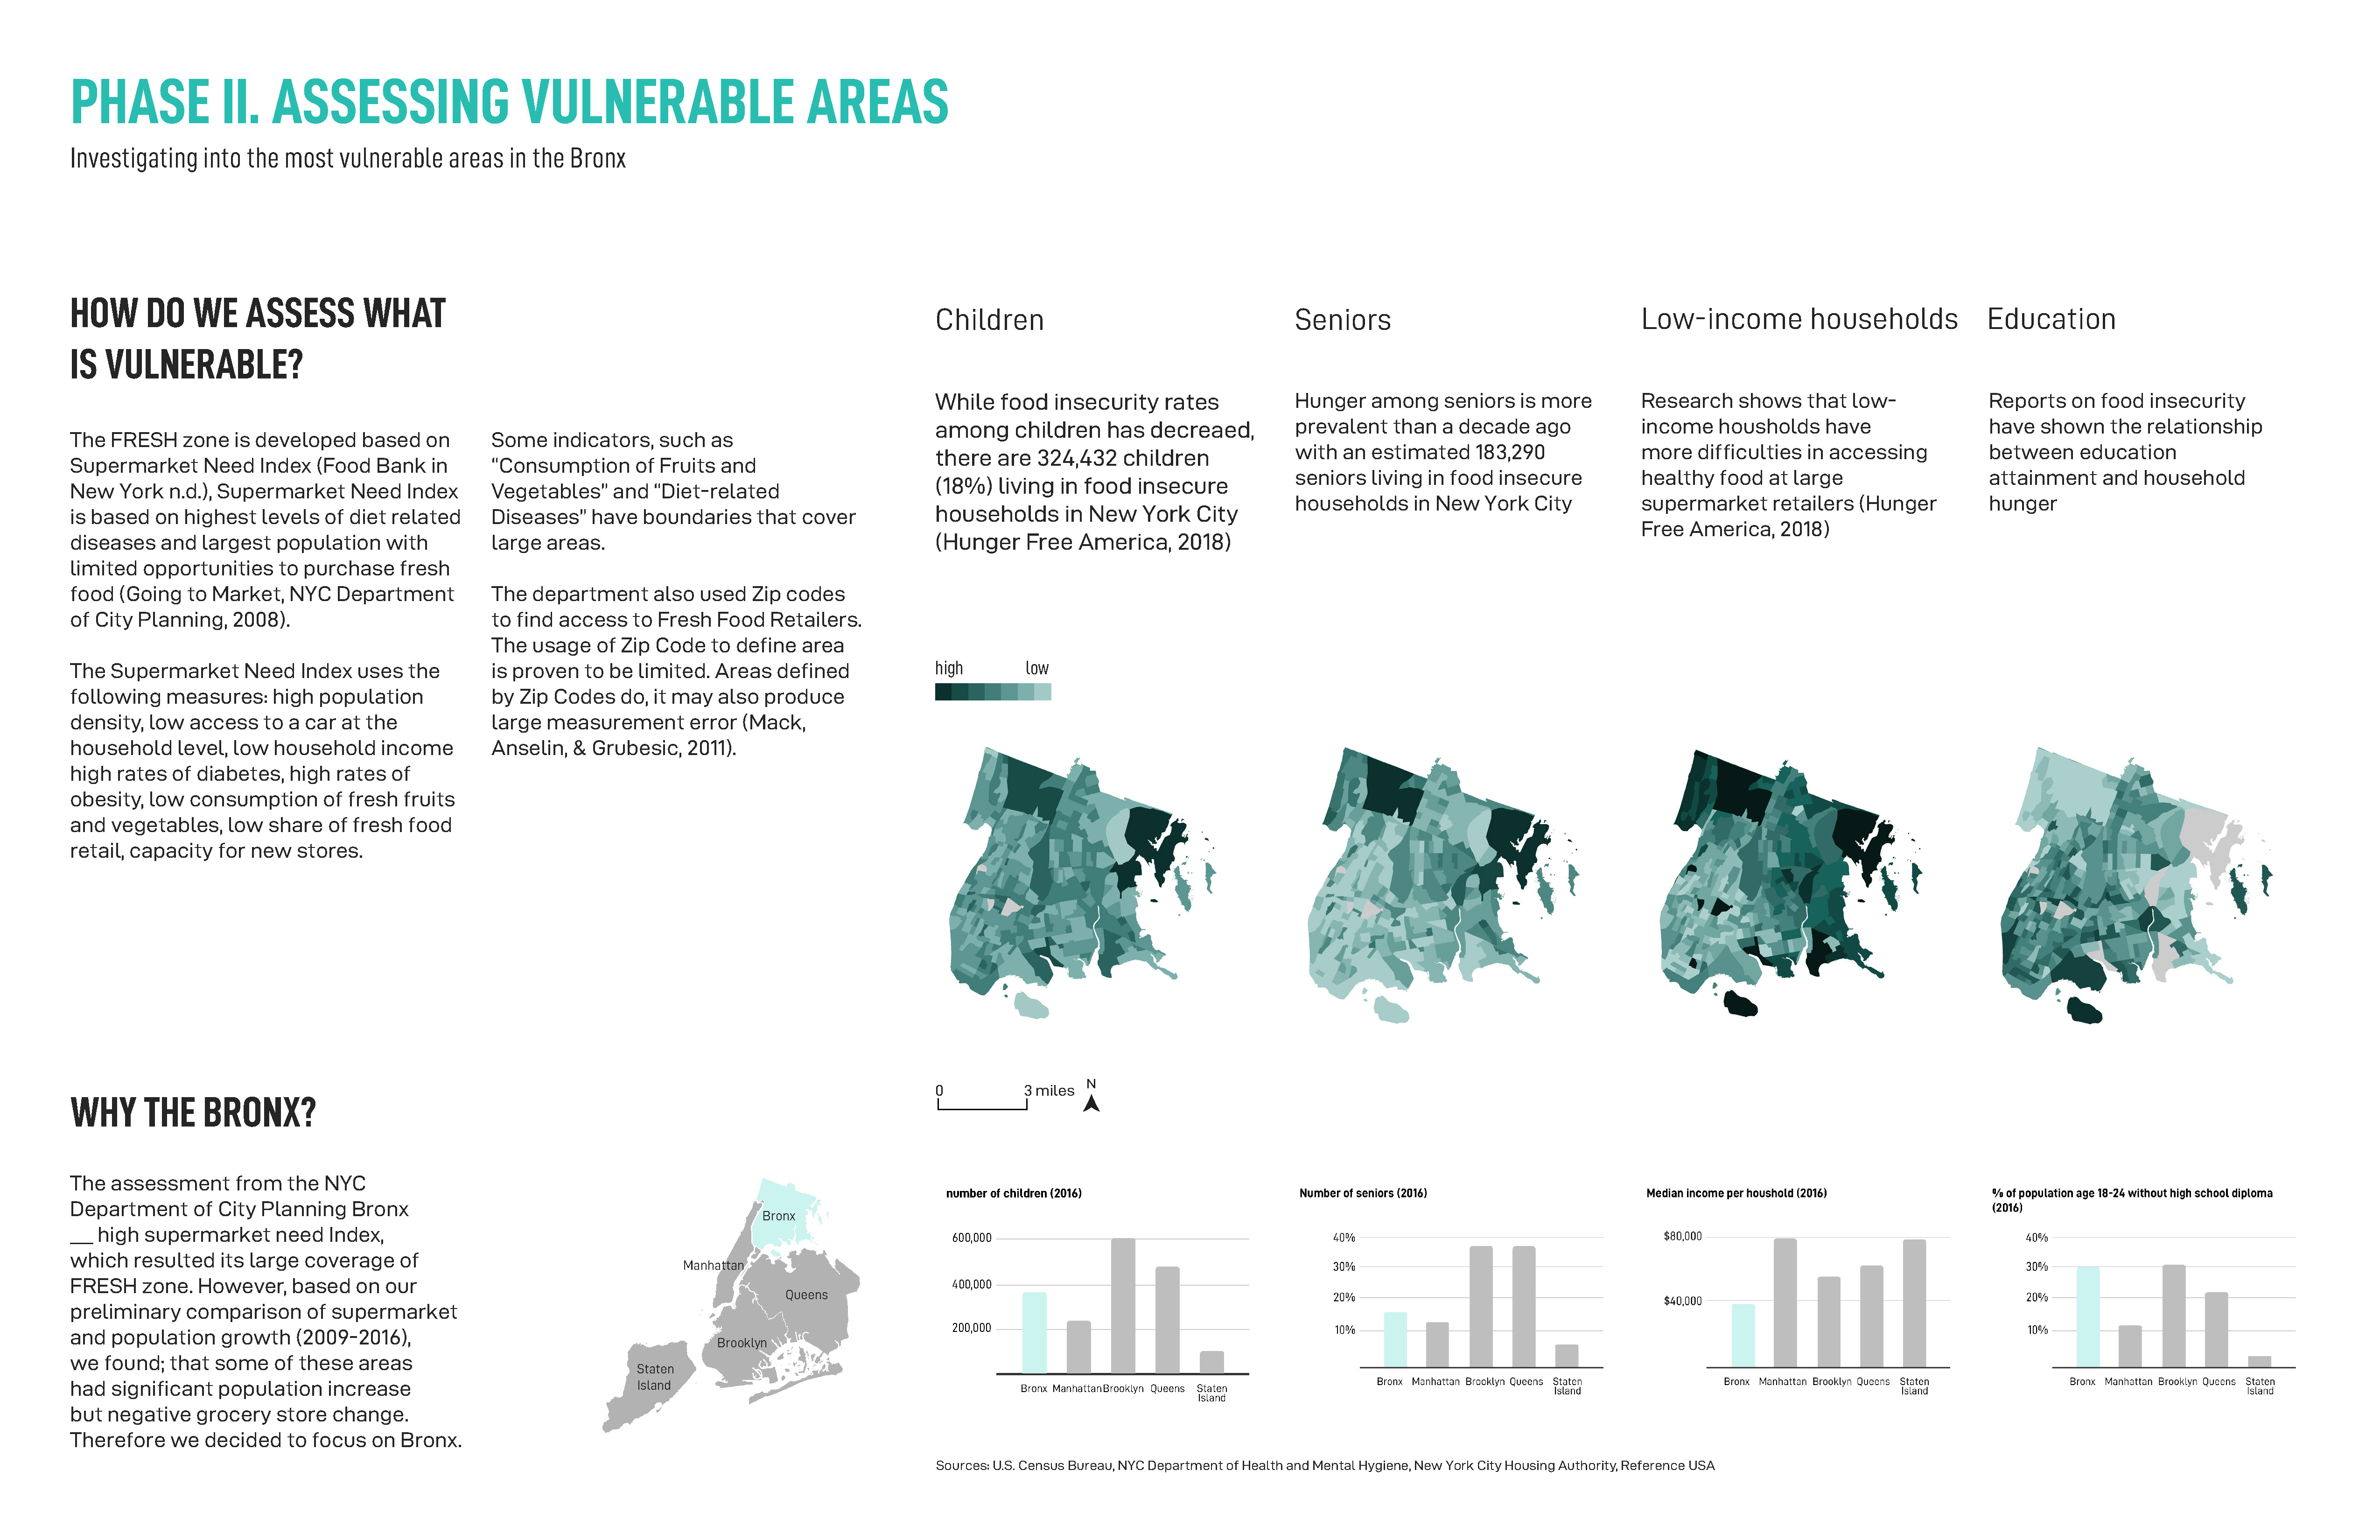
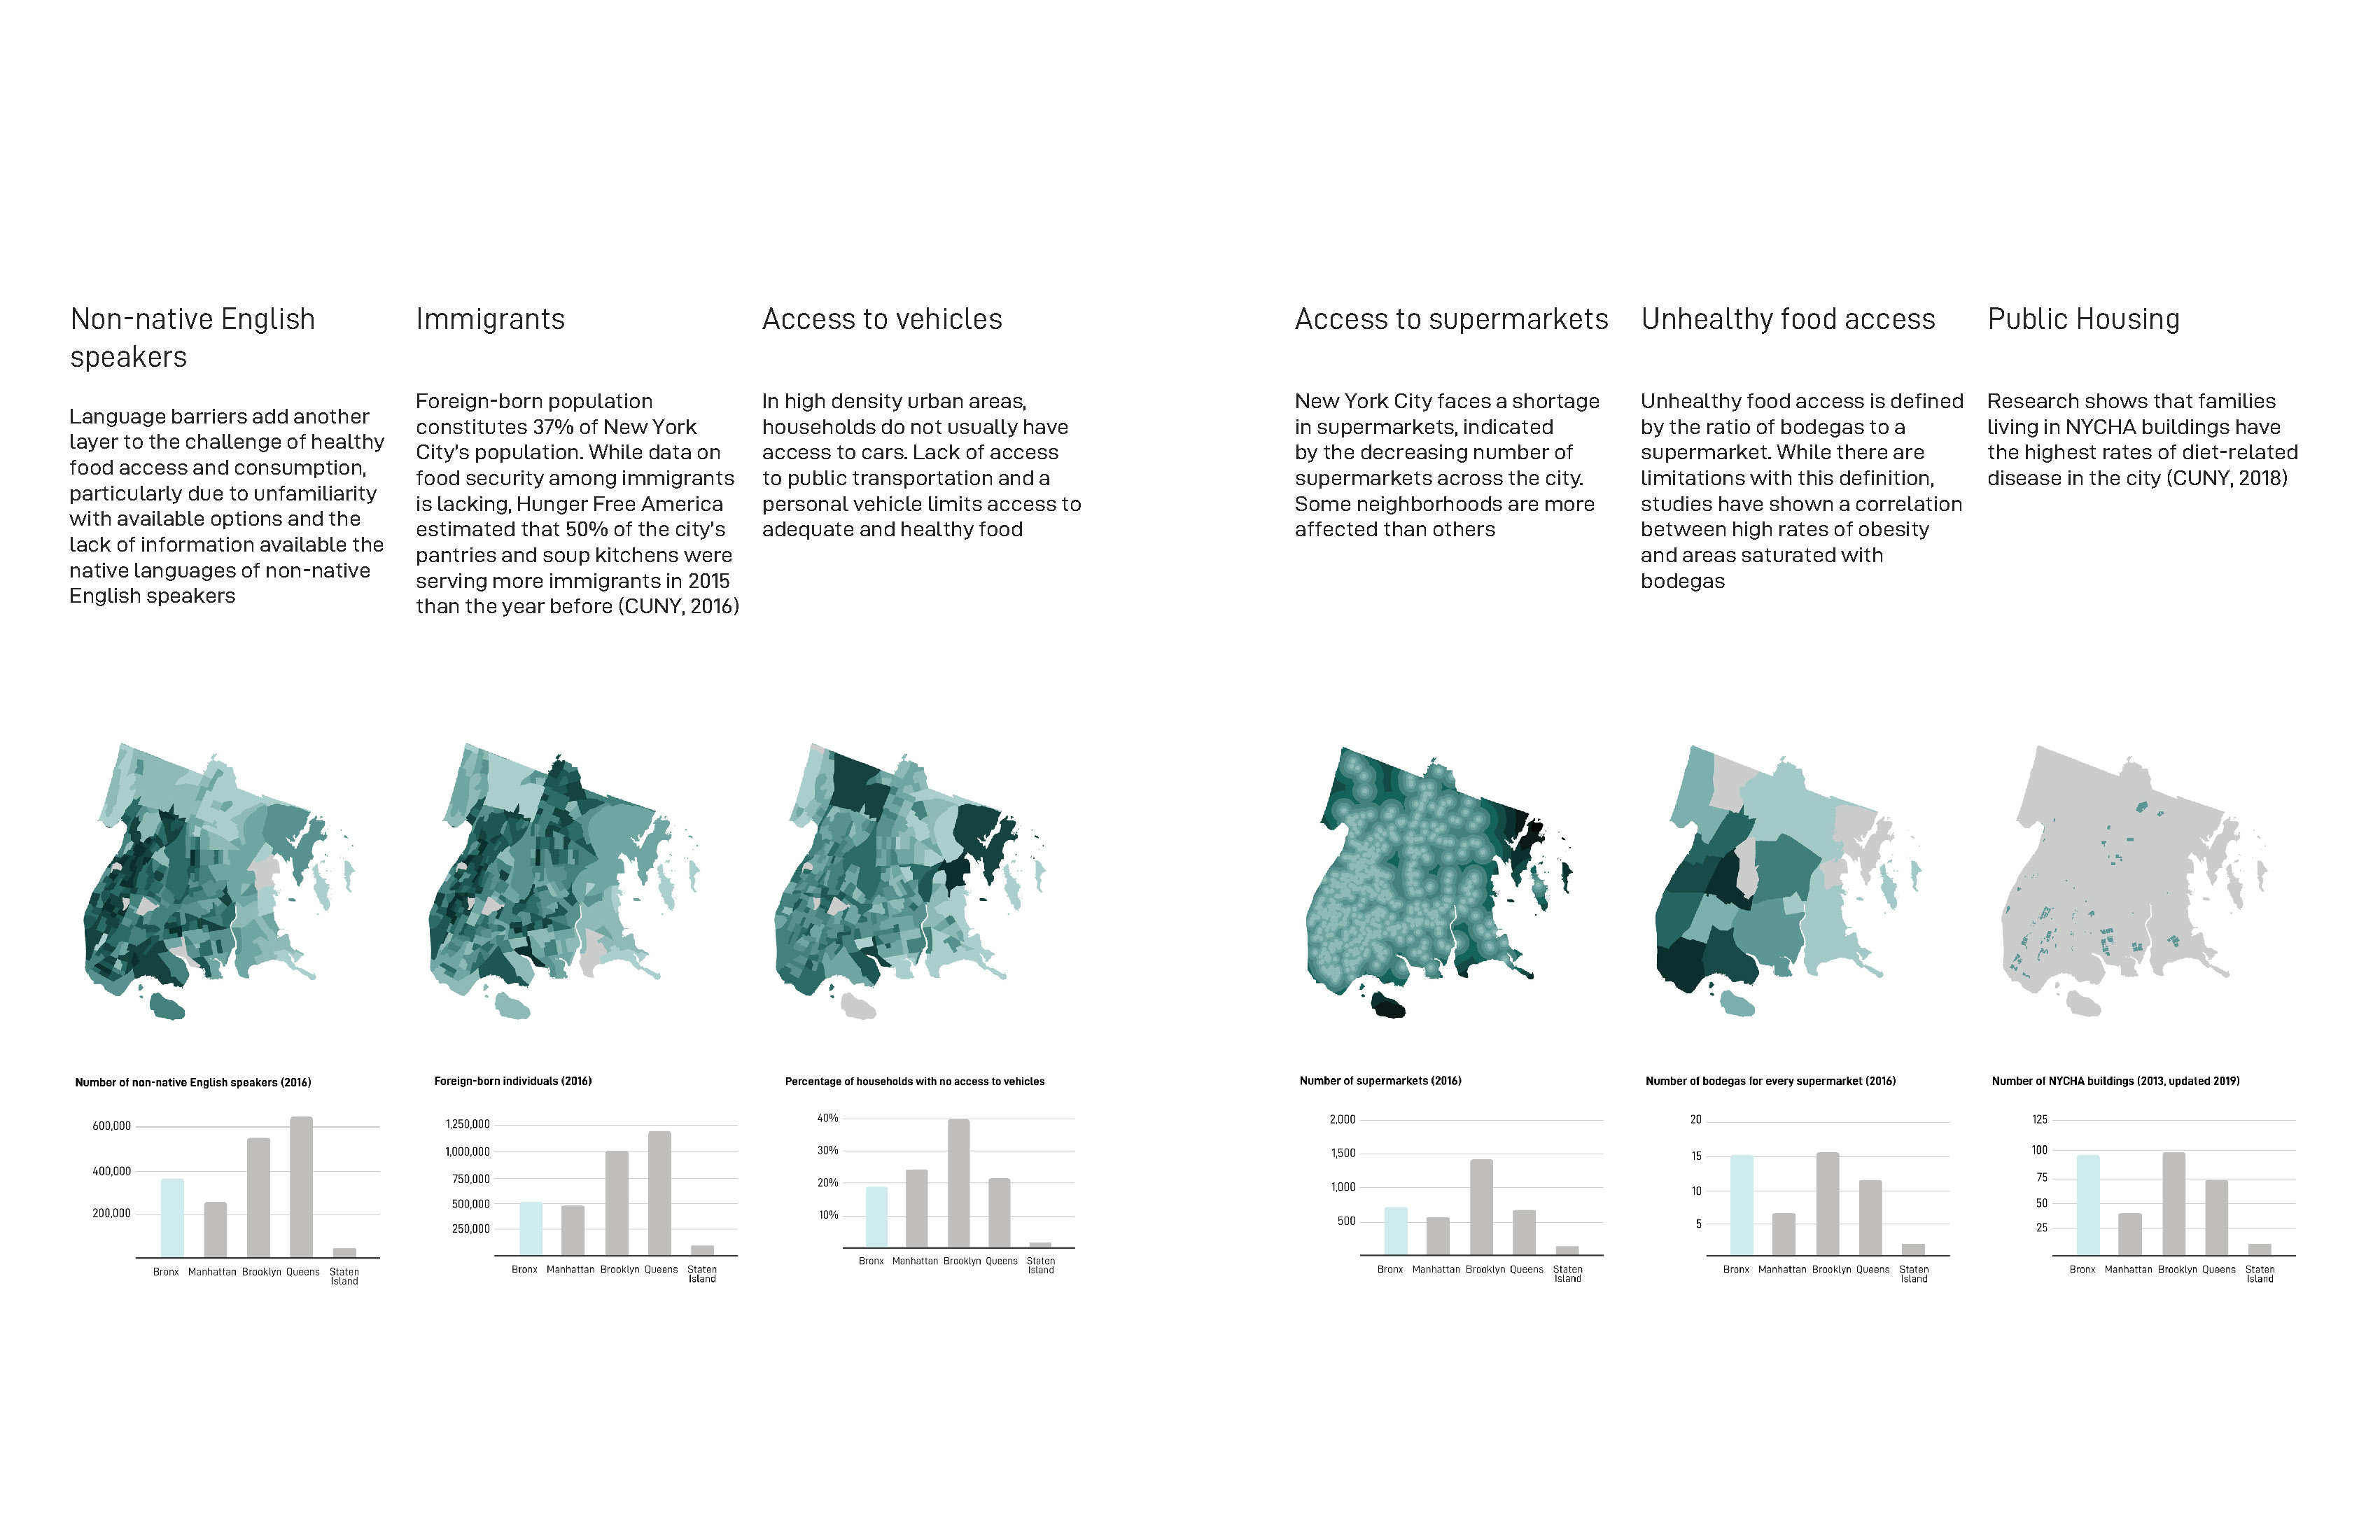
While New York City’s economic growth continues to outpace the United States, 1.2 million of the city’s residents are food insecure, including 18% of all children and 10.9% of all seniors. Food security is defined as having access to adequate food for all household members at all times for an active, healthy life. Food insecurity also increases the risk of obesity and diabetes, and more than half of adult New Yorkers are either overweight or obese. However, negative health outcomes related to food insecurity are more prevalent in some neighborhoods than in the others.
One way that the government has been addressing food insecurity issue in New York City is through identifying ‘food deserts’ or areas lacking fresh fruit, vegetables, and other options for whole foods, as defined by the American Nutrition Association. These areas are often found in low-income neighborhoods. Given a direct relationship between the number of fresh food stores and healthy food consumption, New York City Department of City Planning initiated the creation of the Food Retail Expnasion to Support Health (FRESH) program in 2009 to incentivize supermarket development through zoning requirements and financial benefits.
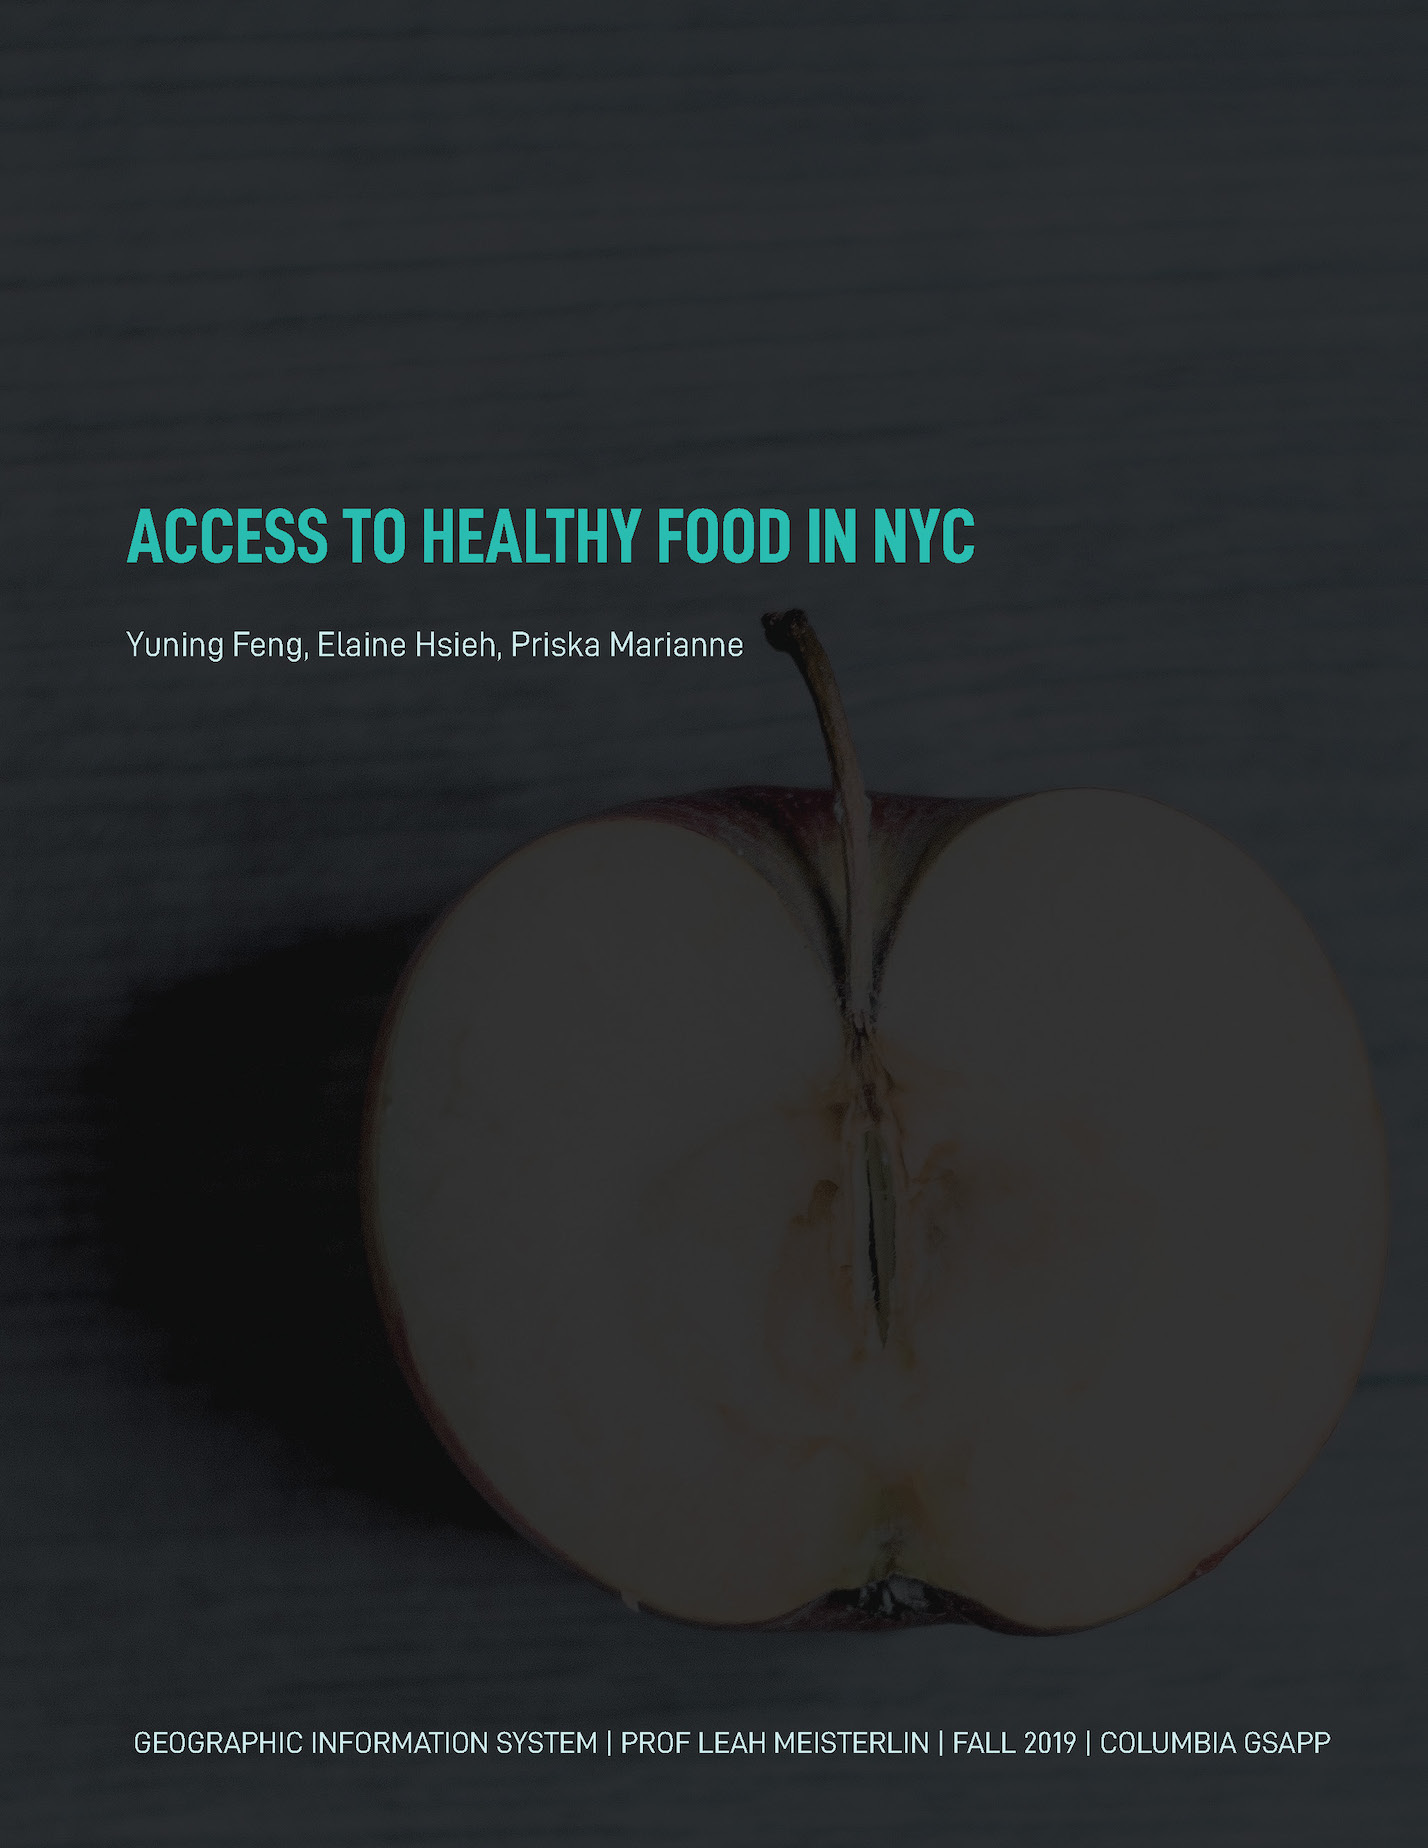
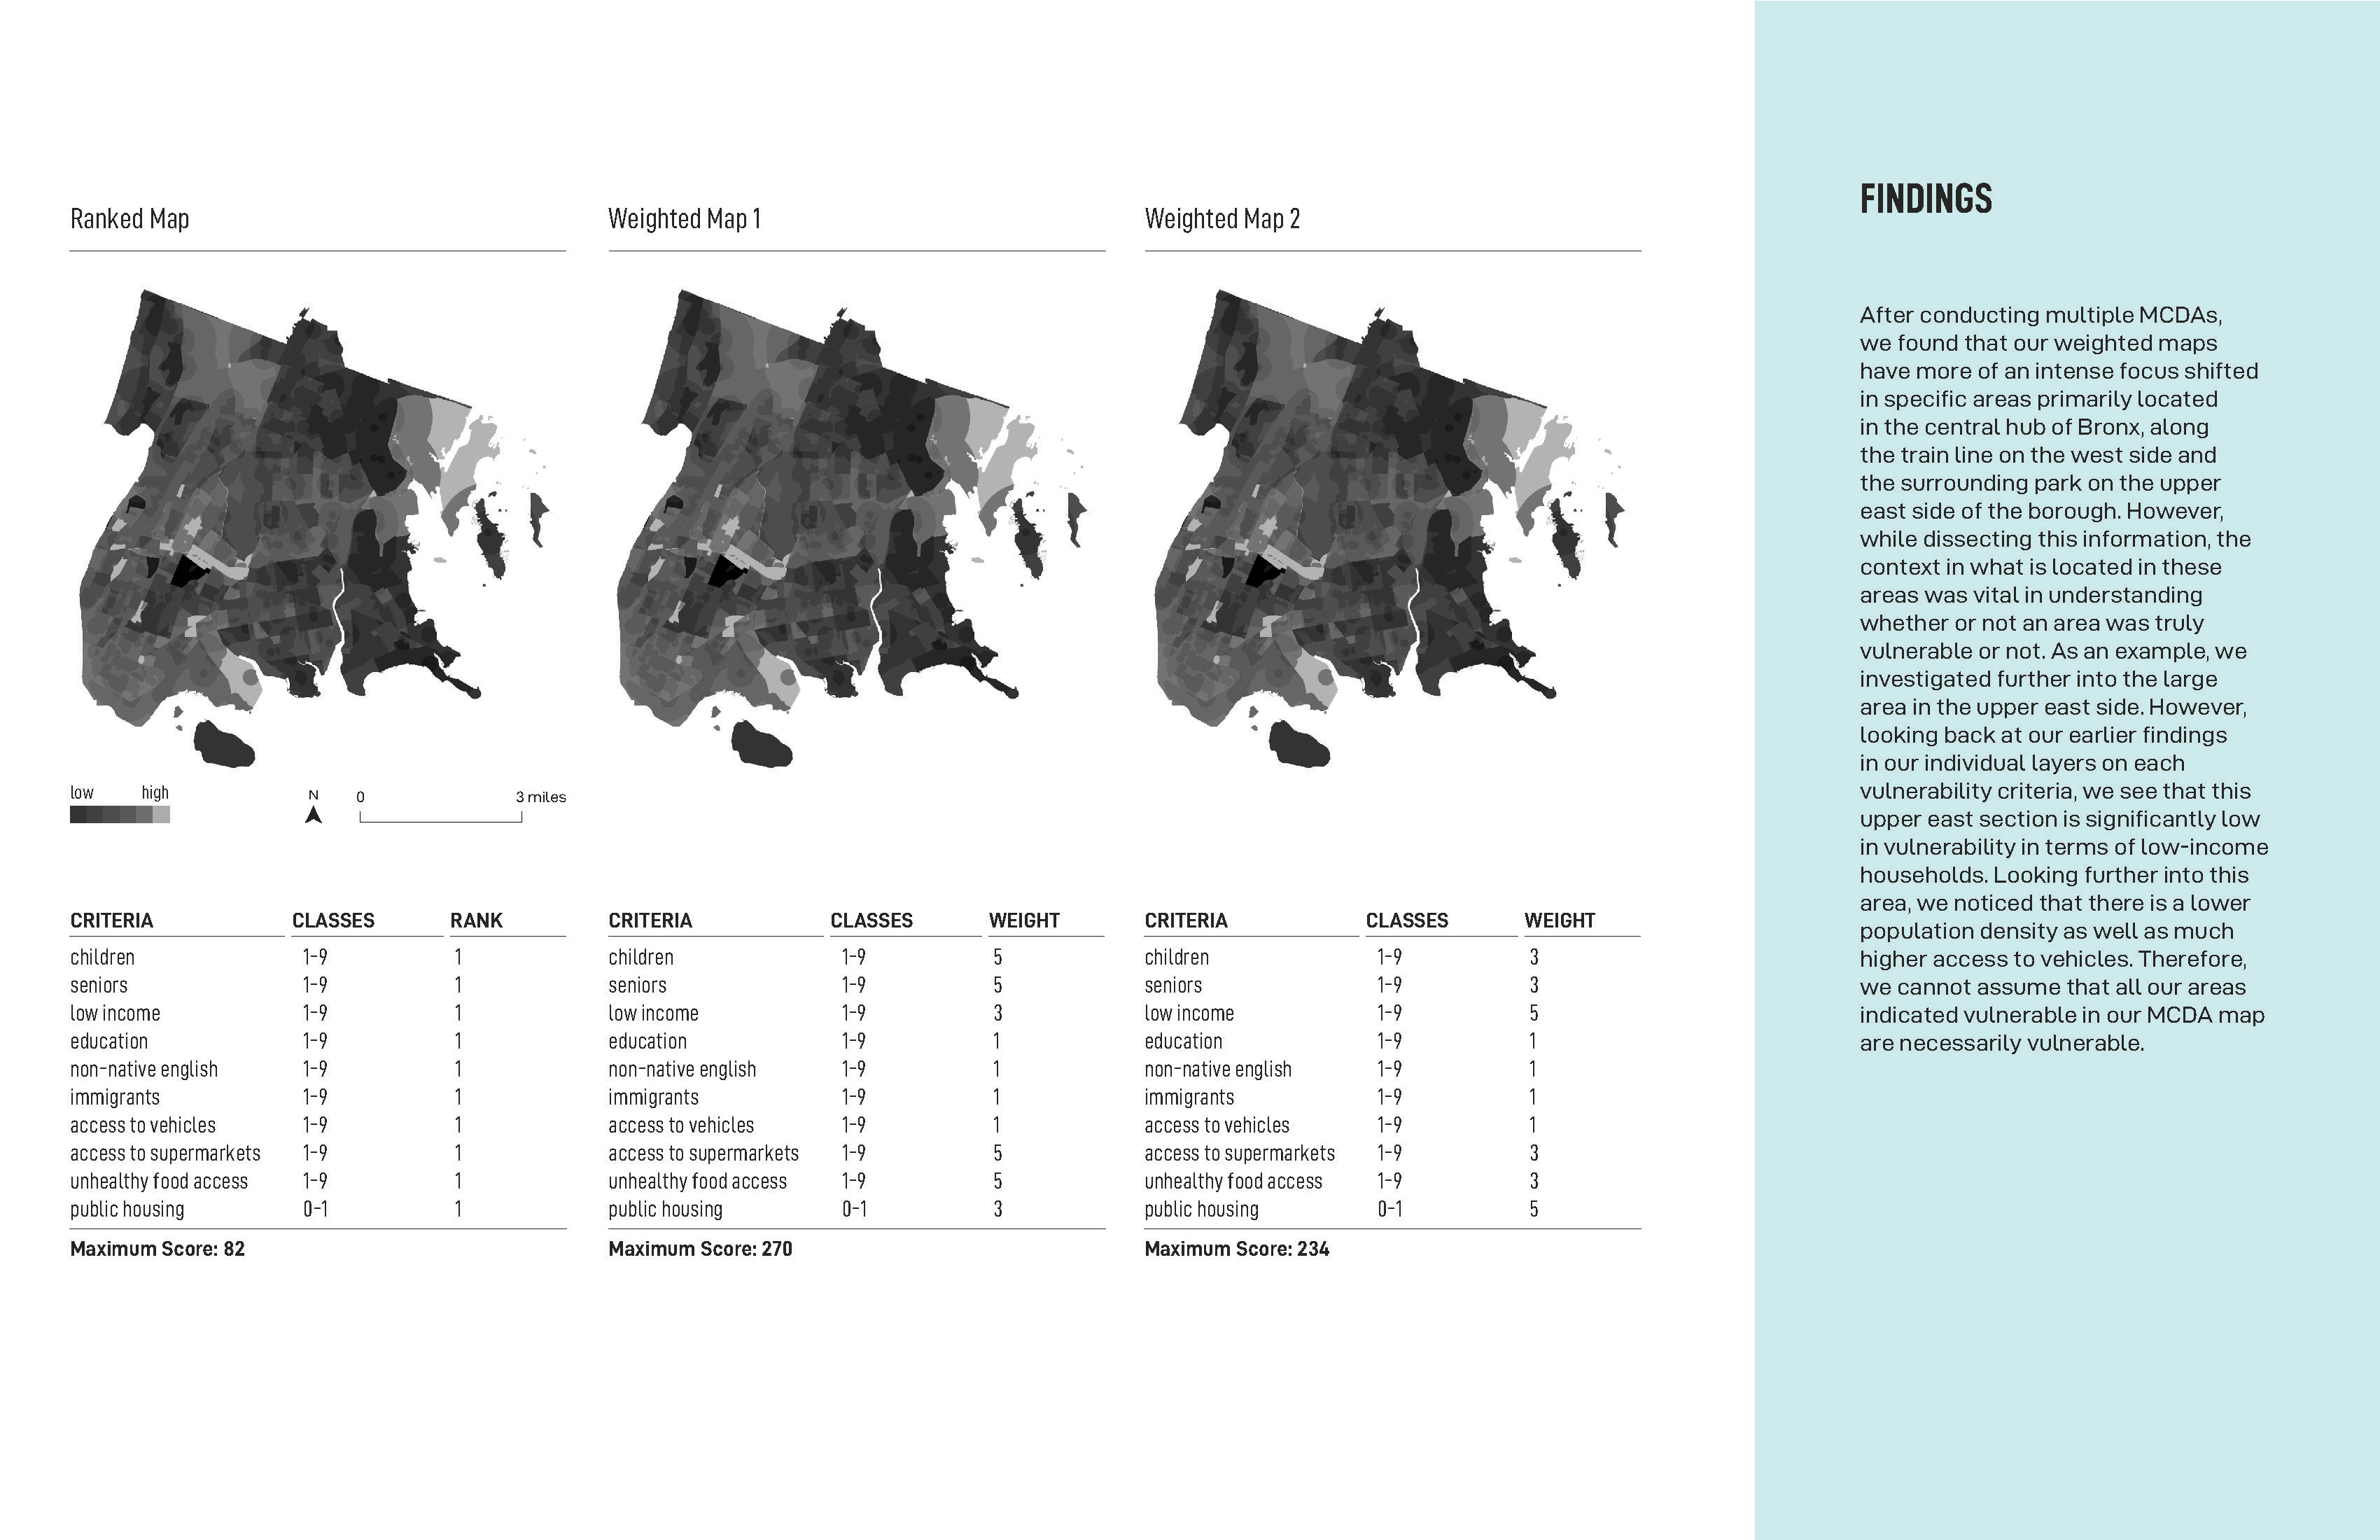
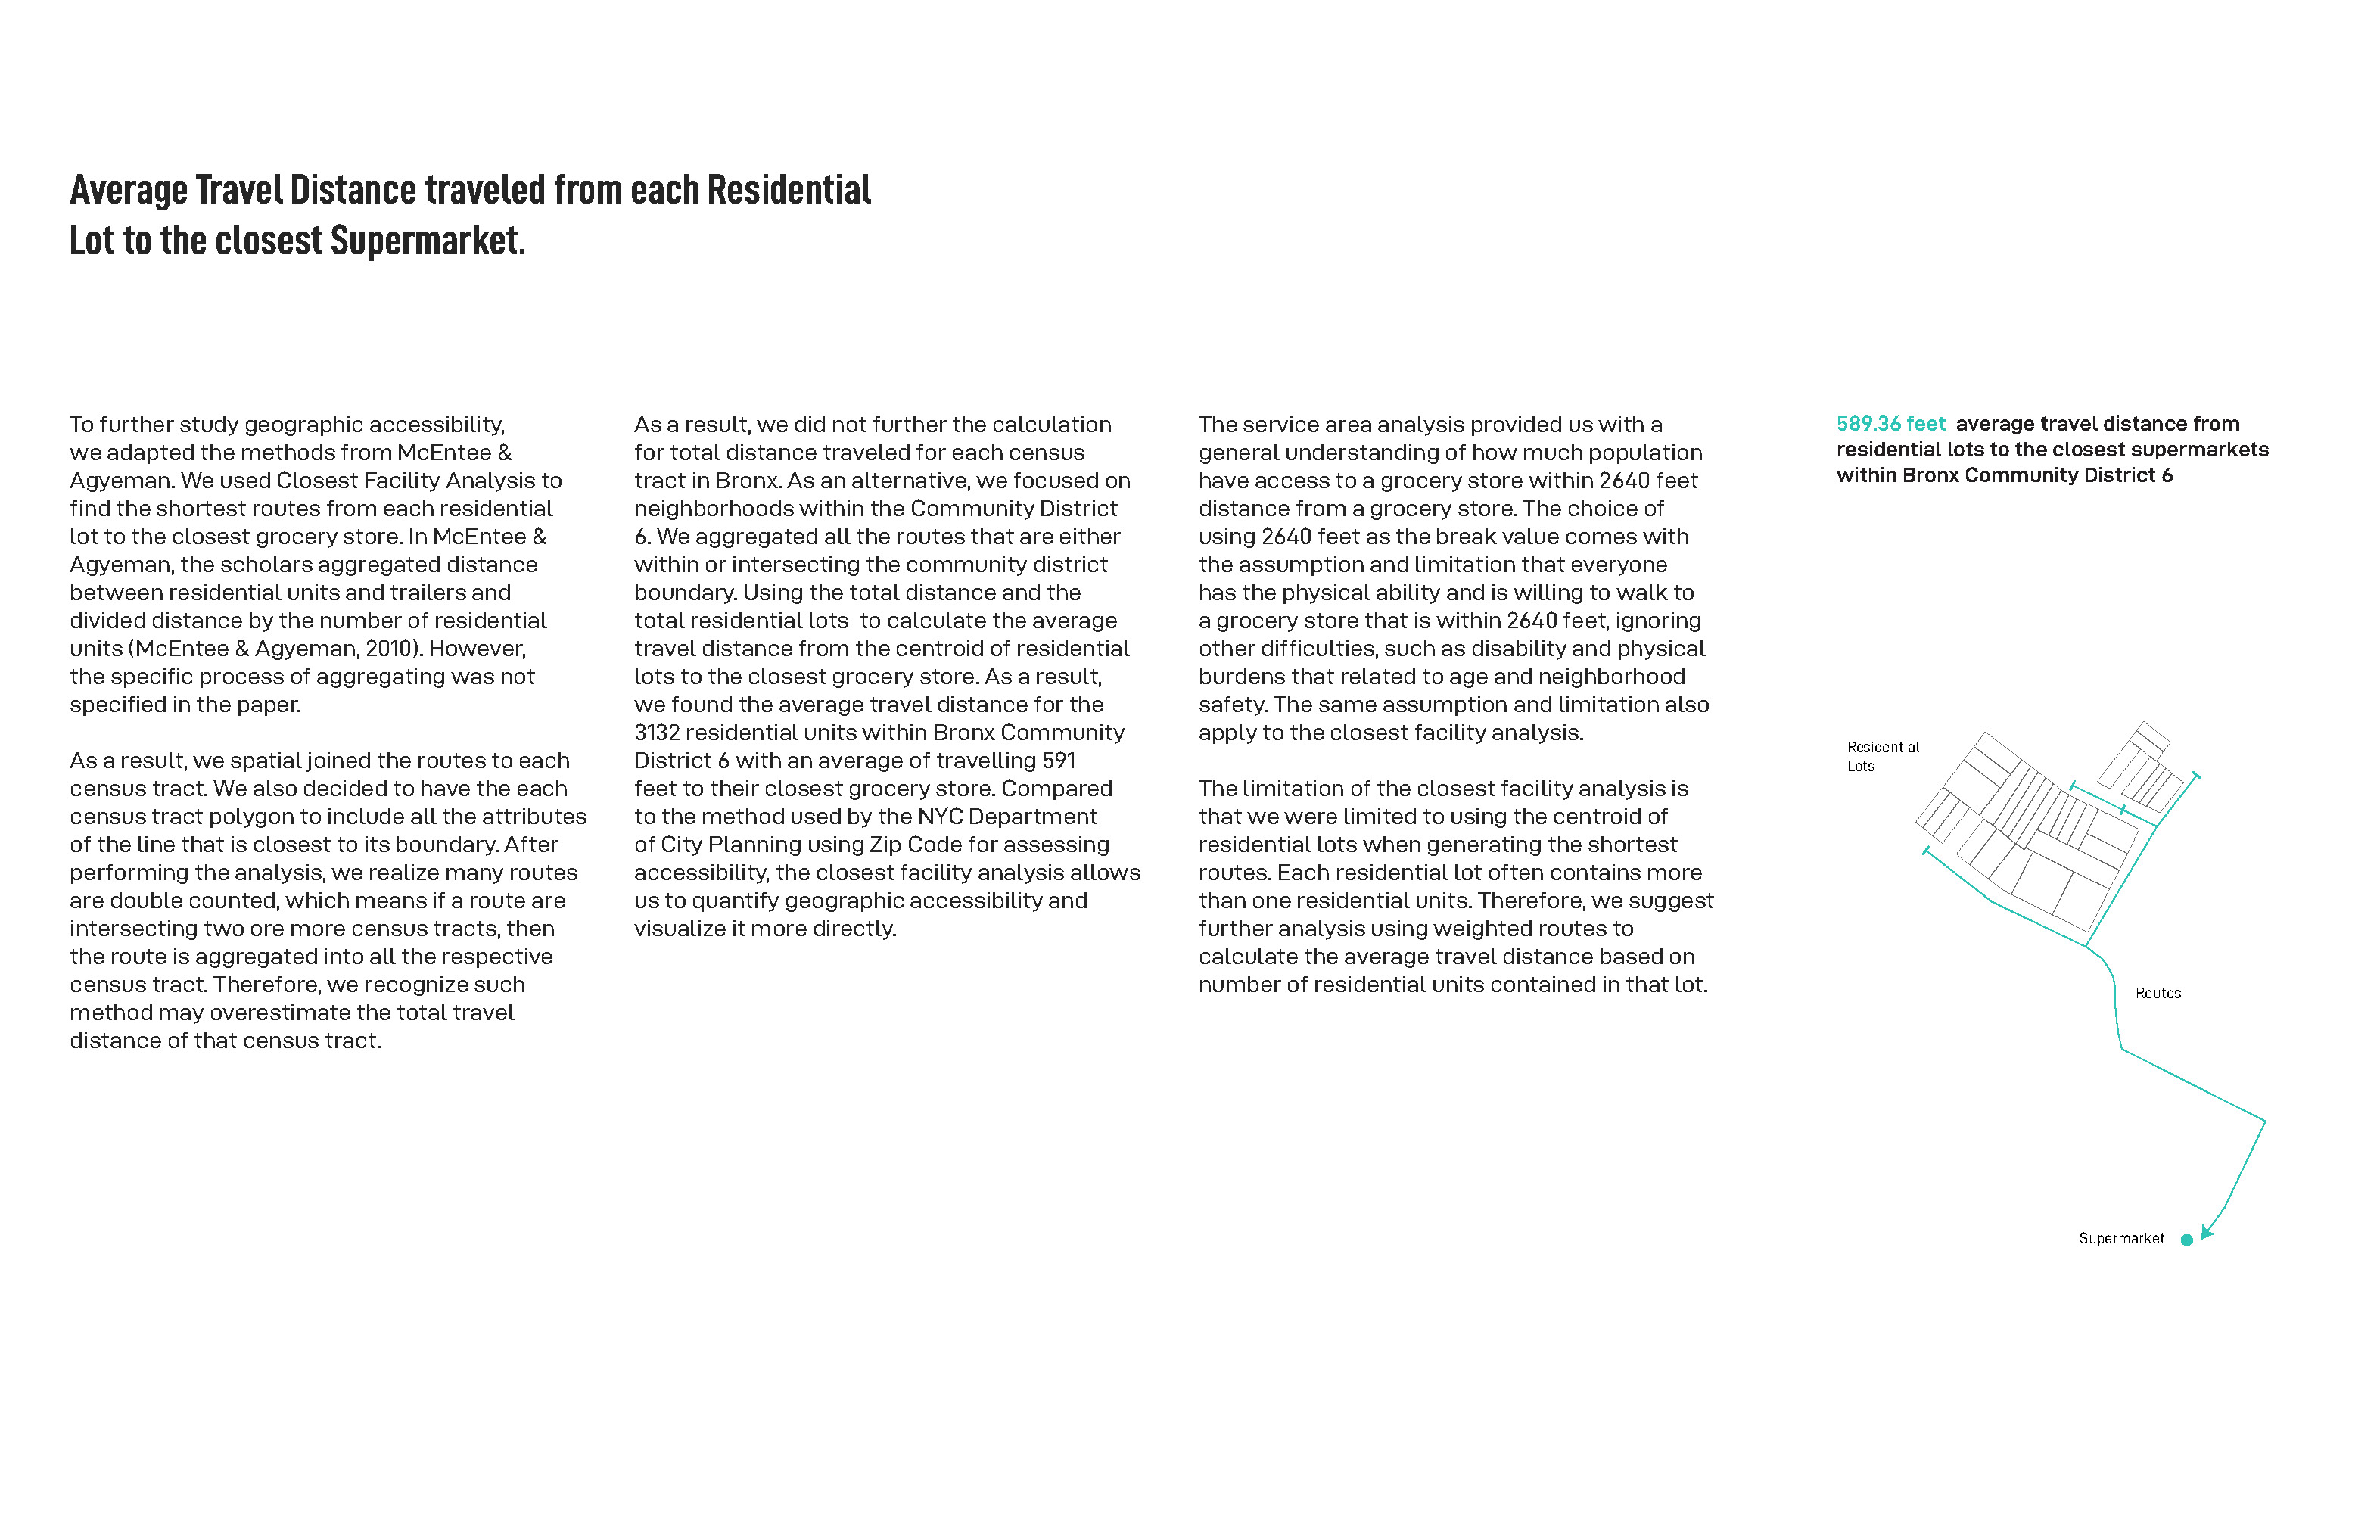
Our study focuses on understanding spatial relationships between the FRESH zone districts and areas in need of healthy food options. Our investigation includes questioning the effectiveness of FRESH zone districts, identifying communities that are vulnerable to food insecurity, and assessing geographic access to supermarkets in vulnerable areas.





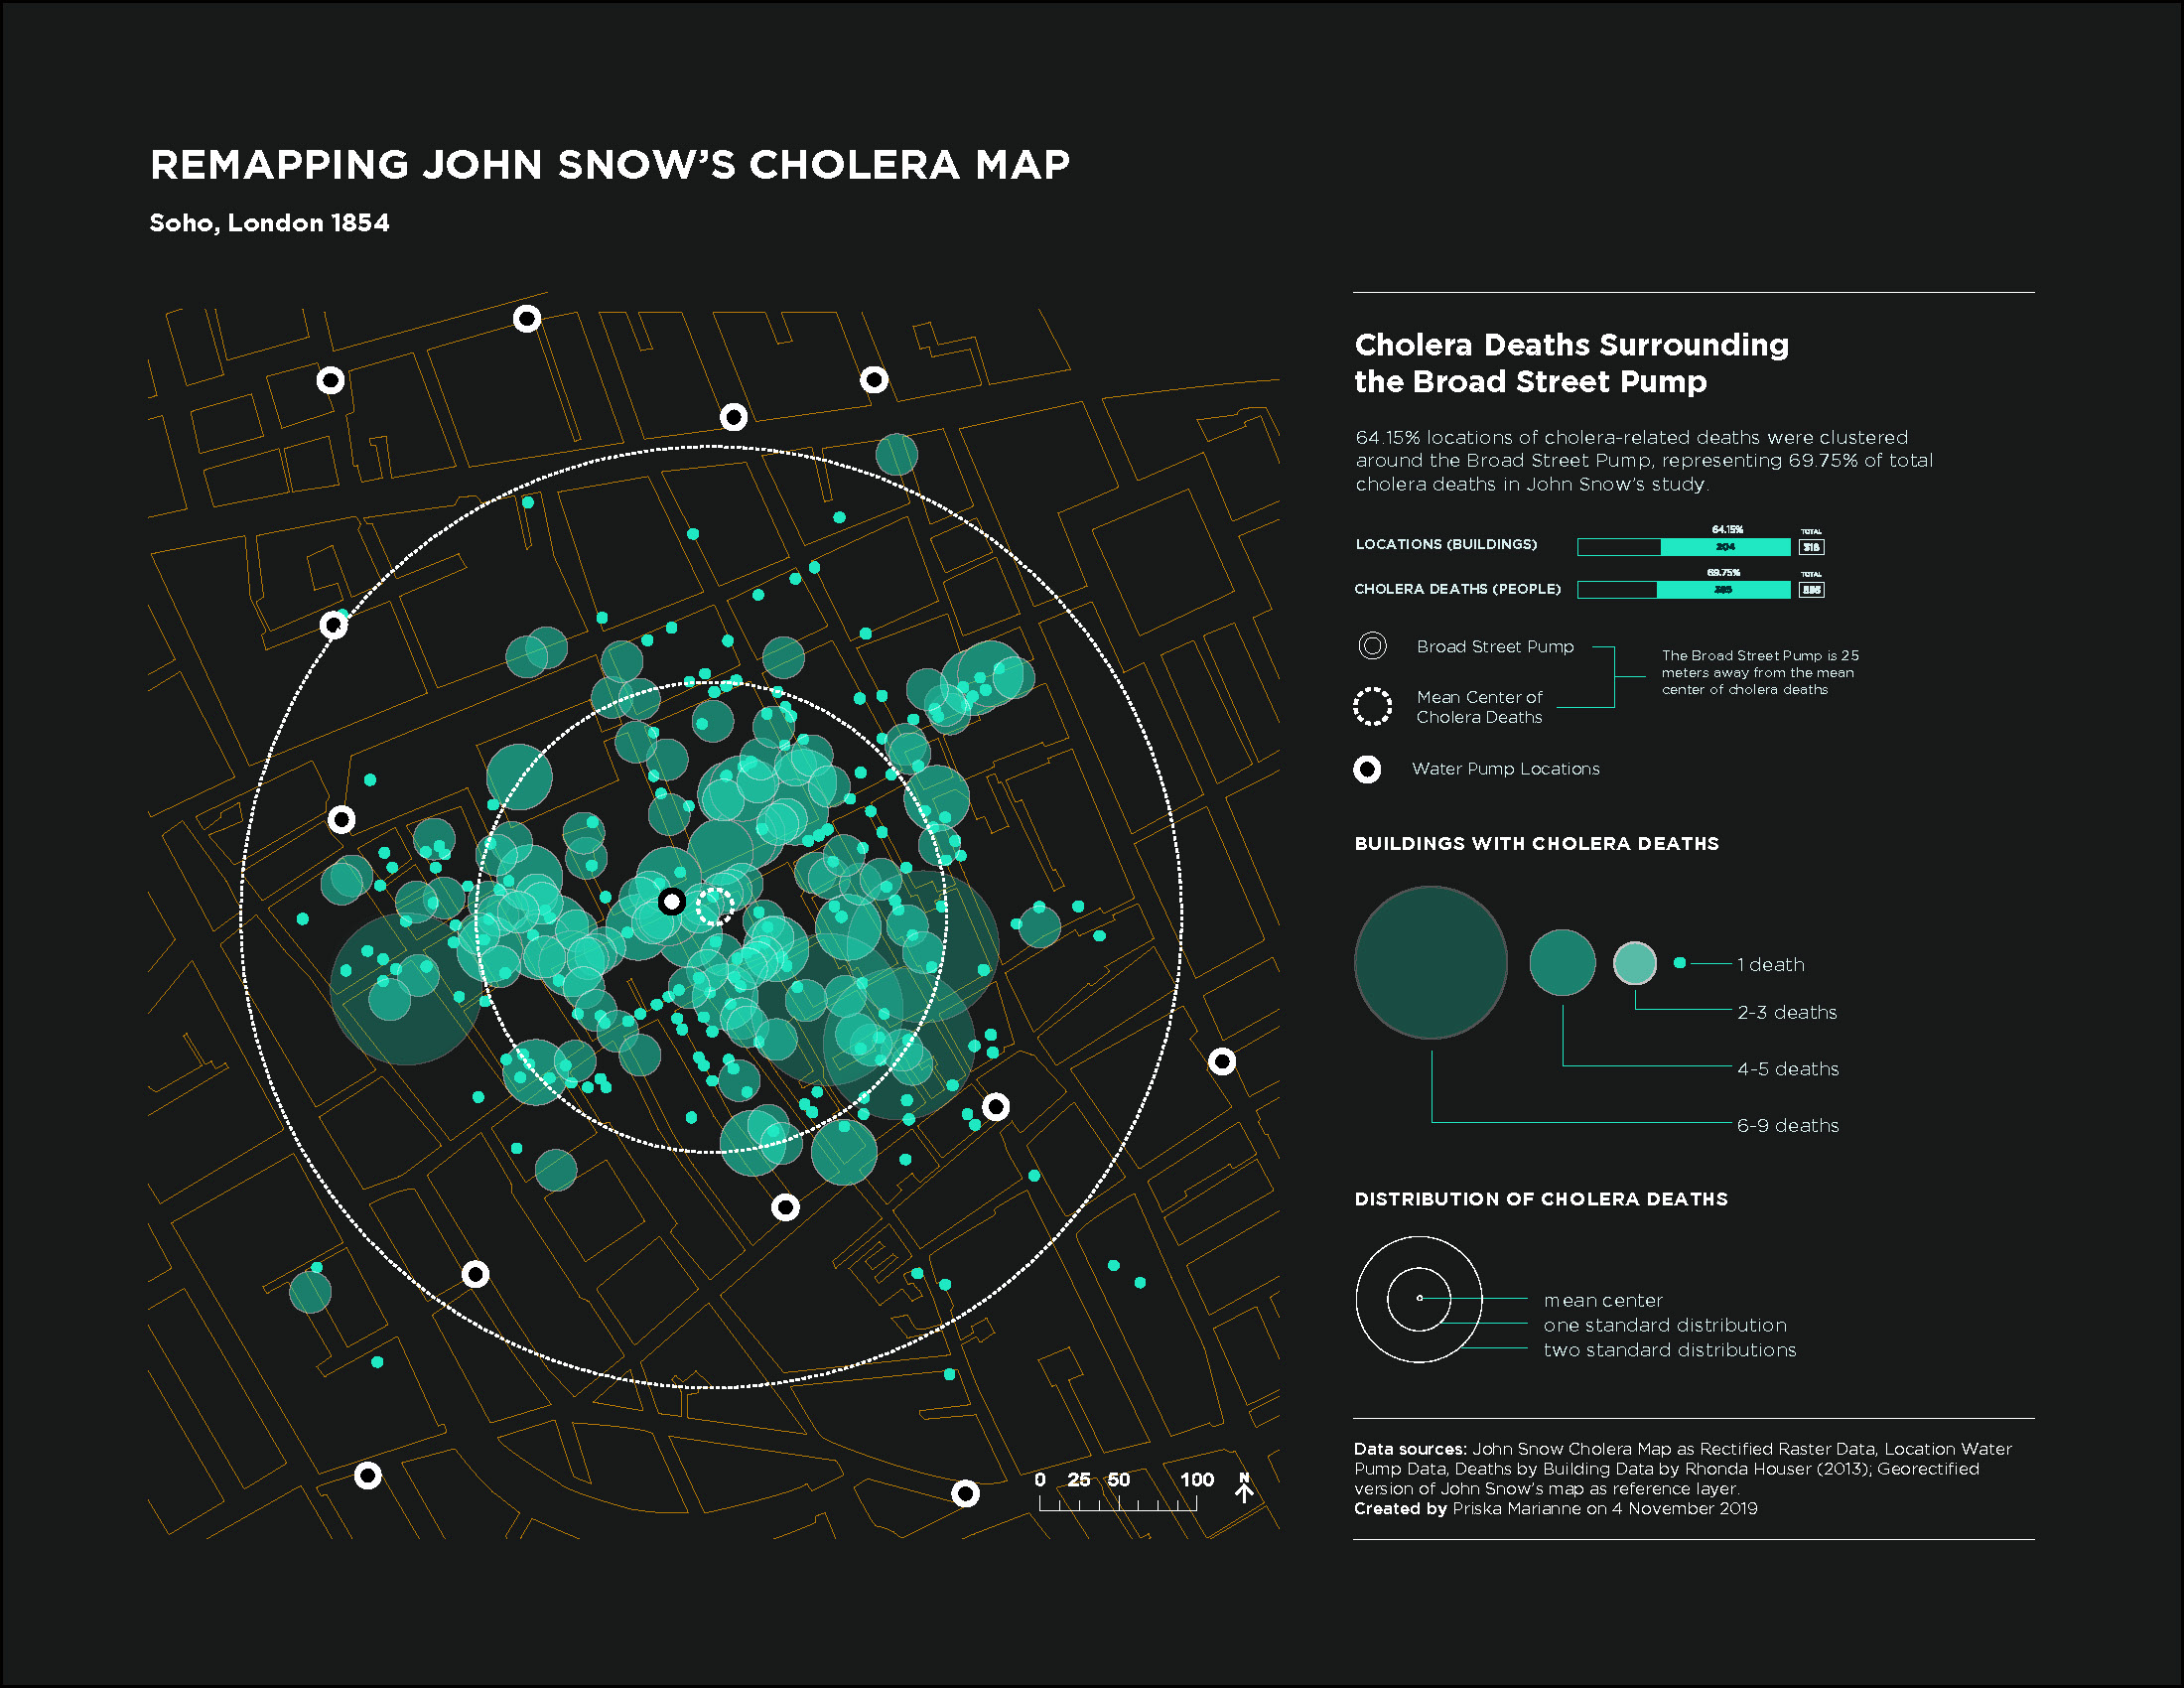
Remapping John Snow’s Cholera Map
2019 | Tools: ArcGIS, Illustrator, InDesign
